Comparing transport infrastructure investment policies around the globe
Download the Statistics Brief as a visual PDF
Long-term policies yield significant modal shifts in investment
The Paris Agreement’s goal of restricting global heating to “well below” 2 degrees Celsius above pre-industrial levels remains within reach, but only just. Avoiding catastrophic climate change requires that the global transport sector shifts to low- and zero-carbon modes to reduce its current share (23%) of energy-related carbon dioxide (CO2) emissions.
On track to green?
Current decisions on investment in transport infrastructure can determine carbon emissions savings for many years to come. Governments face choices to invest in more or less carbon-intensive transport modes. For example, rail projects generate relatively low CO2 emissions compared to more carbon-intensive road transport.
The ITF’s latest data tracks the share of total inland transport investment infrastructure spending that countries dedicate to rail and road projects.
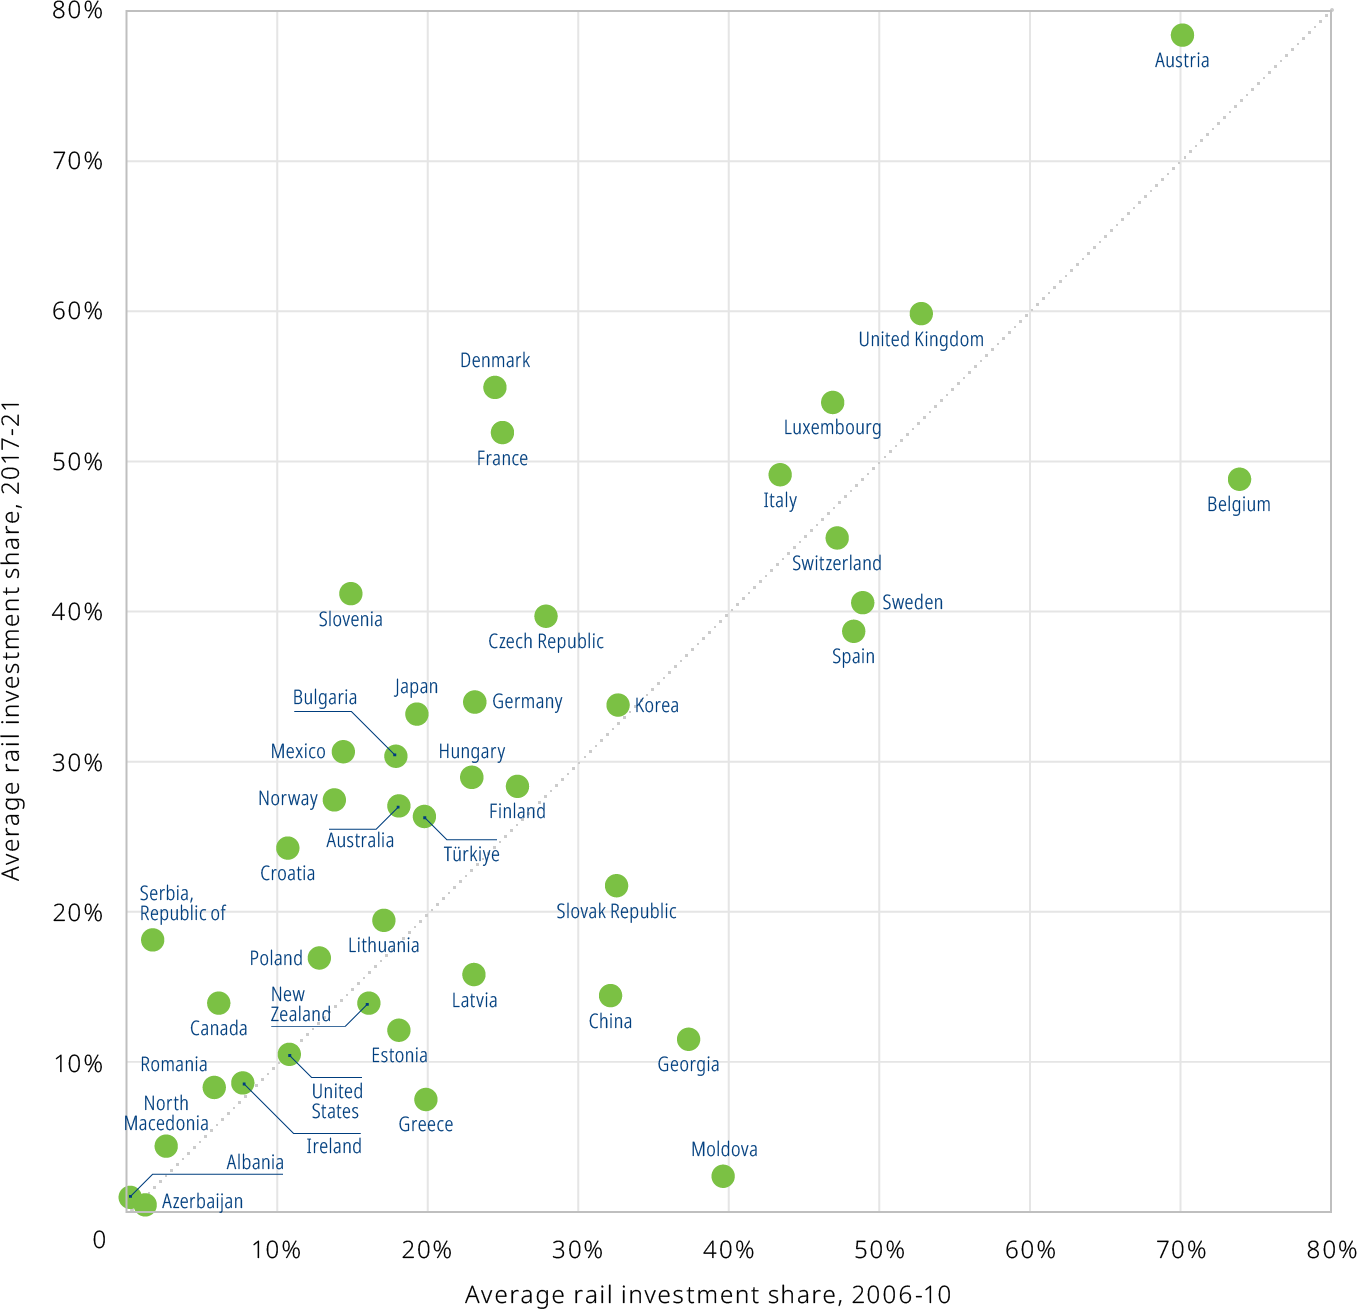
A snapshot comparison between the average share of the total investment in rail for the periods 2006-10 and 2017-21 reveals a general consistency in countries’ new investment priorities by mode, with notable exceptions.
Denmark, for example, saw a massive increase in investment in rail between these two periods, while Moldova saw a substantial decrease in investment in new rail projects.
Share of rail investment in total inland transport investment, average 2006-10 vs. average 2017-21
The Danish “Hour Model”
Denmark ramped up its share of rail spending from 25% to 55% of inland transport infrastructure spending in the five years 2017-21 in a conscious bid to create a more sustainable transport system. A political consensus on the need to shift to cleaner modes has existed in the Scandinavian nation since 2009. Several guiding principles and concrete initiatives formed part of a new green transport policy in place until 2020. One of its pillars was the shift from road to rail. Examples include an extension of the Copenhagen metro, completed in 2019.
To promote the shift to rail for longer-distance trips, the Danish government created a high-speed strategy for inter-city train connections. Labelled the Timemodellen (Hour Model), it aims to reduce travel time between each of the four largest cities in Denmark to 60 minutes or less. As part of the work for the first stage of the model, a new high-speed line between the capital Copenhagen and the city of Ringsted opened in 2019.
Motorways in Moldova
By contrast, Moldova’s outlier position in the modal shift dataset stems from a reduction in rail investment from 40% to just 2% of total inland transport infrastructure expenditure between the two periods. This divestment from rail is coupled with increased spending on road infrastructure. Moldova’s “Local Roads Improvement Project”, financed by the World Bank, began in 2016. The project aims to provide safe and local road access to education, health and market facilities along selected corridors.
The “National Development Strategy Moldova 2020: Priority 2 – good roads everywhere” was adopted in 2010 and led to the development of the National Strategy on Transport and Logistics for 2013-22. The Eastern European nation seeks a long-term increase in public investment for national and local road infrastructure to reduce transport costs and increase access and speed.
A decade of data reveals infrastructure funding targets
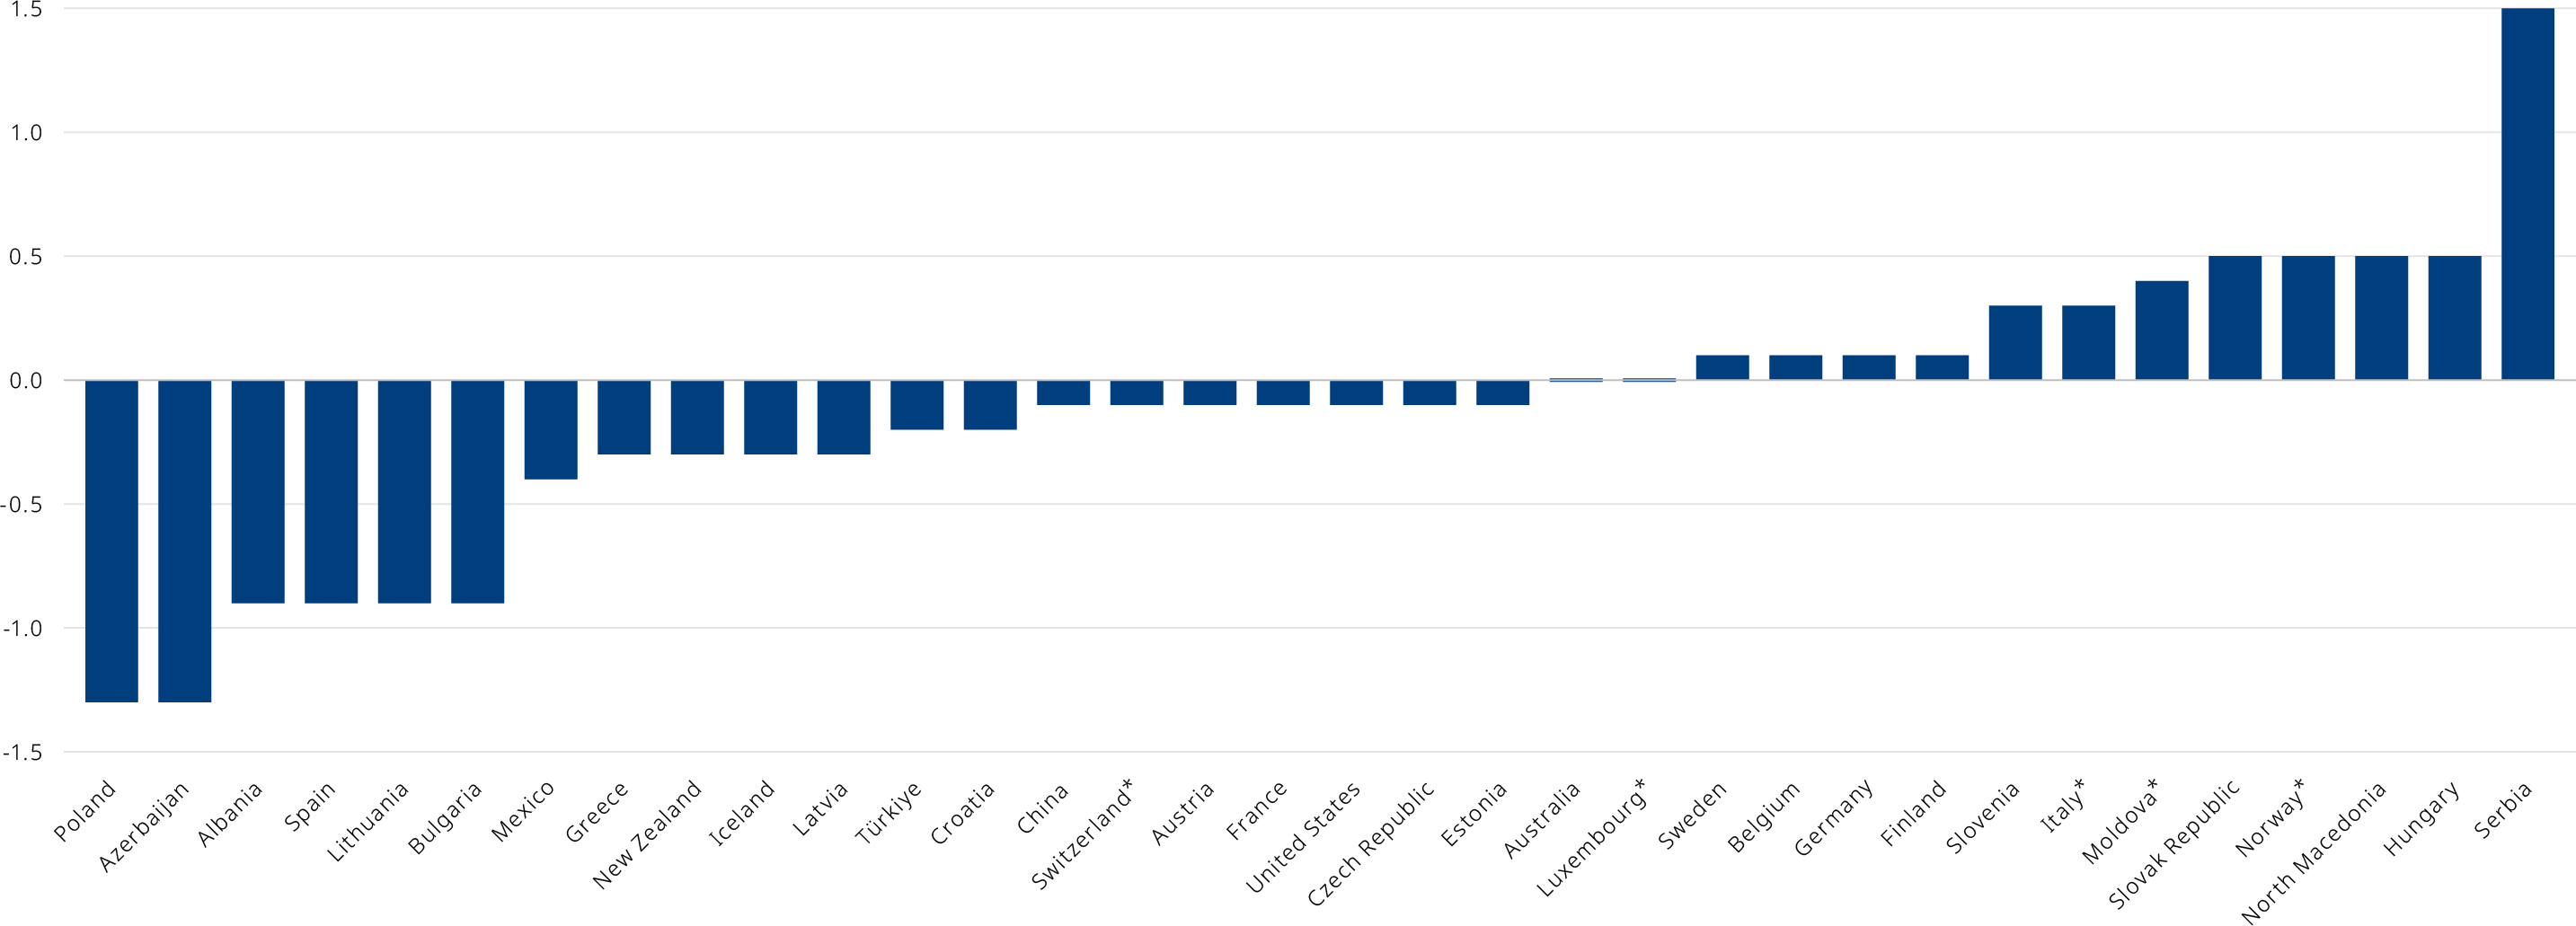
Using the latest available data (2021) to explore changes in investment levels over time since 2010 reveals significant variations across the globe. The percentage of gross domestic product (GDP) invested in new inland infrastructure projects more than halved in some countries, falling most pronouncedly in Poland but increasing markedly in others, notably Serbia.
The data show that countries with well-developed transport infrastructure – Luxembourg and Sweden, for example – spend relatively stable amounts on new infrastructure.
Difference in total inland infrastructure spending as a percentage of GDP, 2010-21 (in percentage points), *2020 data
Poland completes major funding cycle
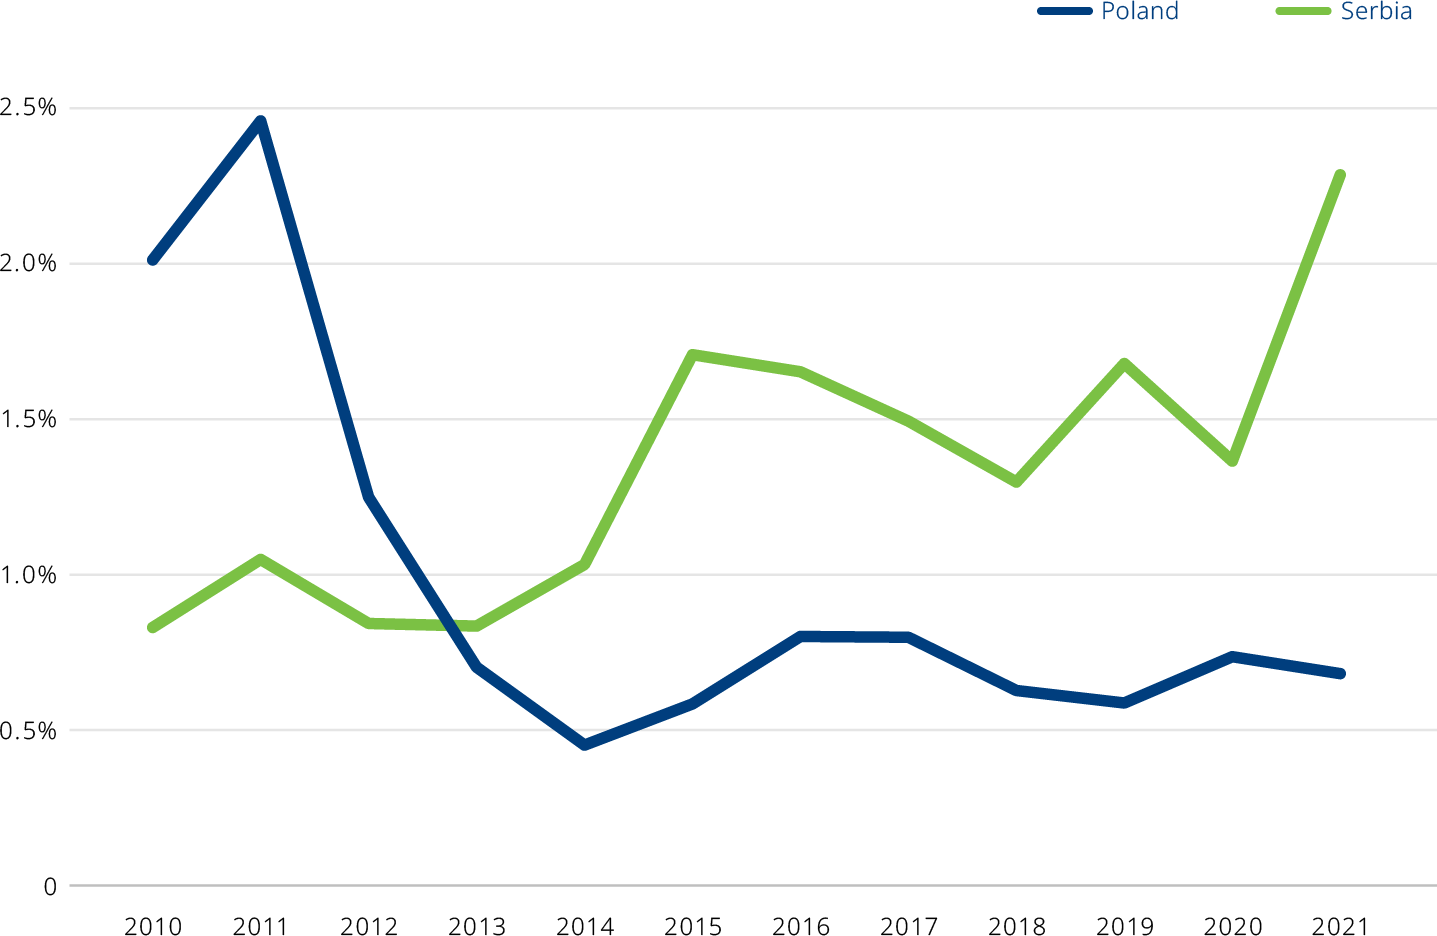
Poland saw the greatest drop in total inland infrastructure spending as a percentage of GDP, which fell 1.3 percentage points between 2010 and 2021. This period coincided with the completion of the 2007-13 funding cycle of the European Regional Development Fund (ERDF) and the European Union’s Cohesion Fund (CF).
Between 2007 and 2013, the EU’s fifth-most populous member state received more than EUR 25 billion from the ERDF and CF for infrastructure projects. Around two-thirds were invested in roads, with the remainder shared between rail and other modes.
Some 77% of the funding (EUR 19.7 billion) was concentrated in the national “Infrastructure and Environment Operational Programme (OP)”, with the remainder divided between the 16 regional OPs (EUR 4.9 billion) and the Development of Eastern Poland OP (EUR 1.1 billion). Nearly 80% of the funding was allocated to major projects, 135 in total.
European Union connectivity programme powers Serbian investment
Infrastructure underfunding is a longstanding problem for Serbia. The government has aimed to address this issue in recent years via grants and loans, leading to a building boom, notably in road infrastructure.
In contrast with Poland, which records relative investment stability from 2015, total inland infrastructure investment spending increased in Serbia between 2015 and 2021, with the construction of Pan-European transport corridors 10 and 11. Corridor 10 is one of the most important axes running through landlocked Serbia, connecting with Austria, Bulgaria, Croatia, Greece, Hungary, North Macedonia and Slovenia. Corridor 11, meanwhile, is a ferry and motorway axis linking Bari (Italy), with Bucharest (Romania), via Montenegro and Serbia.
Corridor 10, in particular, aims to bring the Serbian transport system up to EU standards. The project will increase traffic speeds and service levels to facilitate the flow of international trade and passenger transport. Once finalised, the motorway should boost commerce and contribute to regional development across the wider Balkans region.
Total inland infrastructure spending as a percentage of GDP in Poland and Serbia, 2010-21
Infrastructure investment shows Covid-19 immunity
The latest data on infrastructure investment across the globe collected by the ITF confirms that the Covid-19 pandemic has had no significant impact on investment in transport infrastructure.
This finding is not necessarily surprising, given the long-term nature of most, if not all, transport infrastructure programmes.
However, it also confirms that transport infrastructure investment decisions remain immune, to a certain extent, to short-term effects the disruptions caused by the pandemic might have had.
The chart compares transport infrastructure investment in 2019 (the year before the pandemic) with 2021 (the latest full year for which data is available). While some changes in spending occurred, these are not statistically significant.
Total inland infrastructure investment spending as a percentage of GDP in 2019 and 2021
Spotlight on China's investment lead
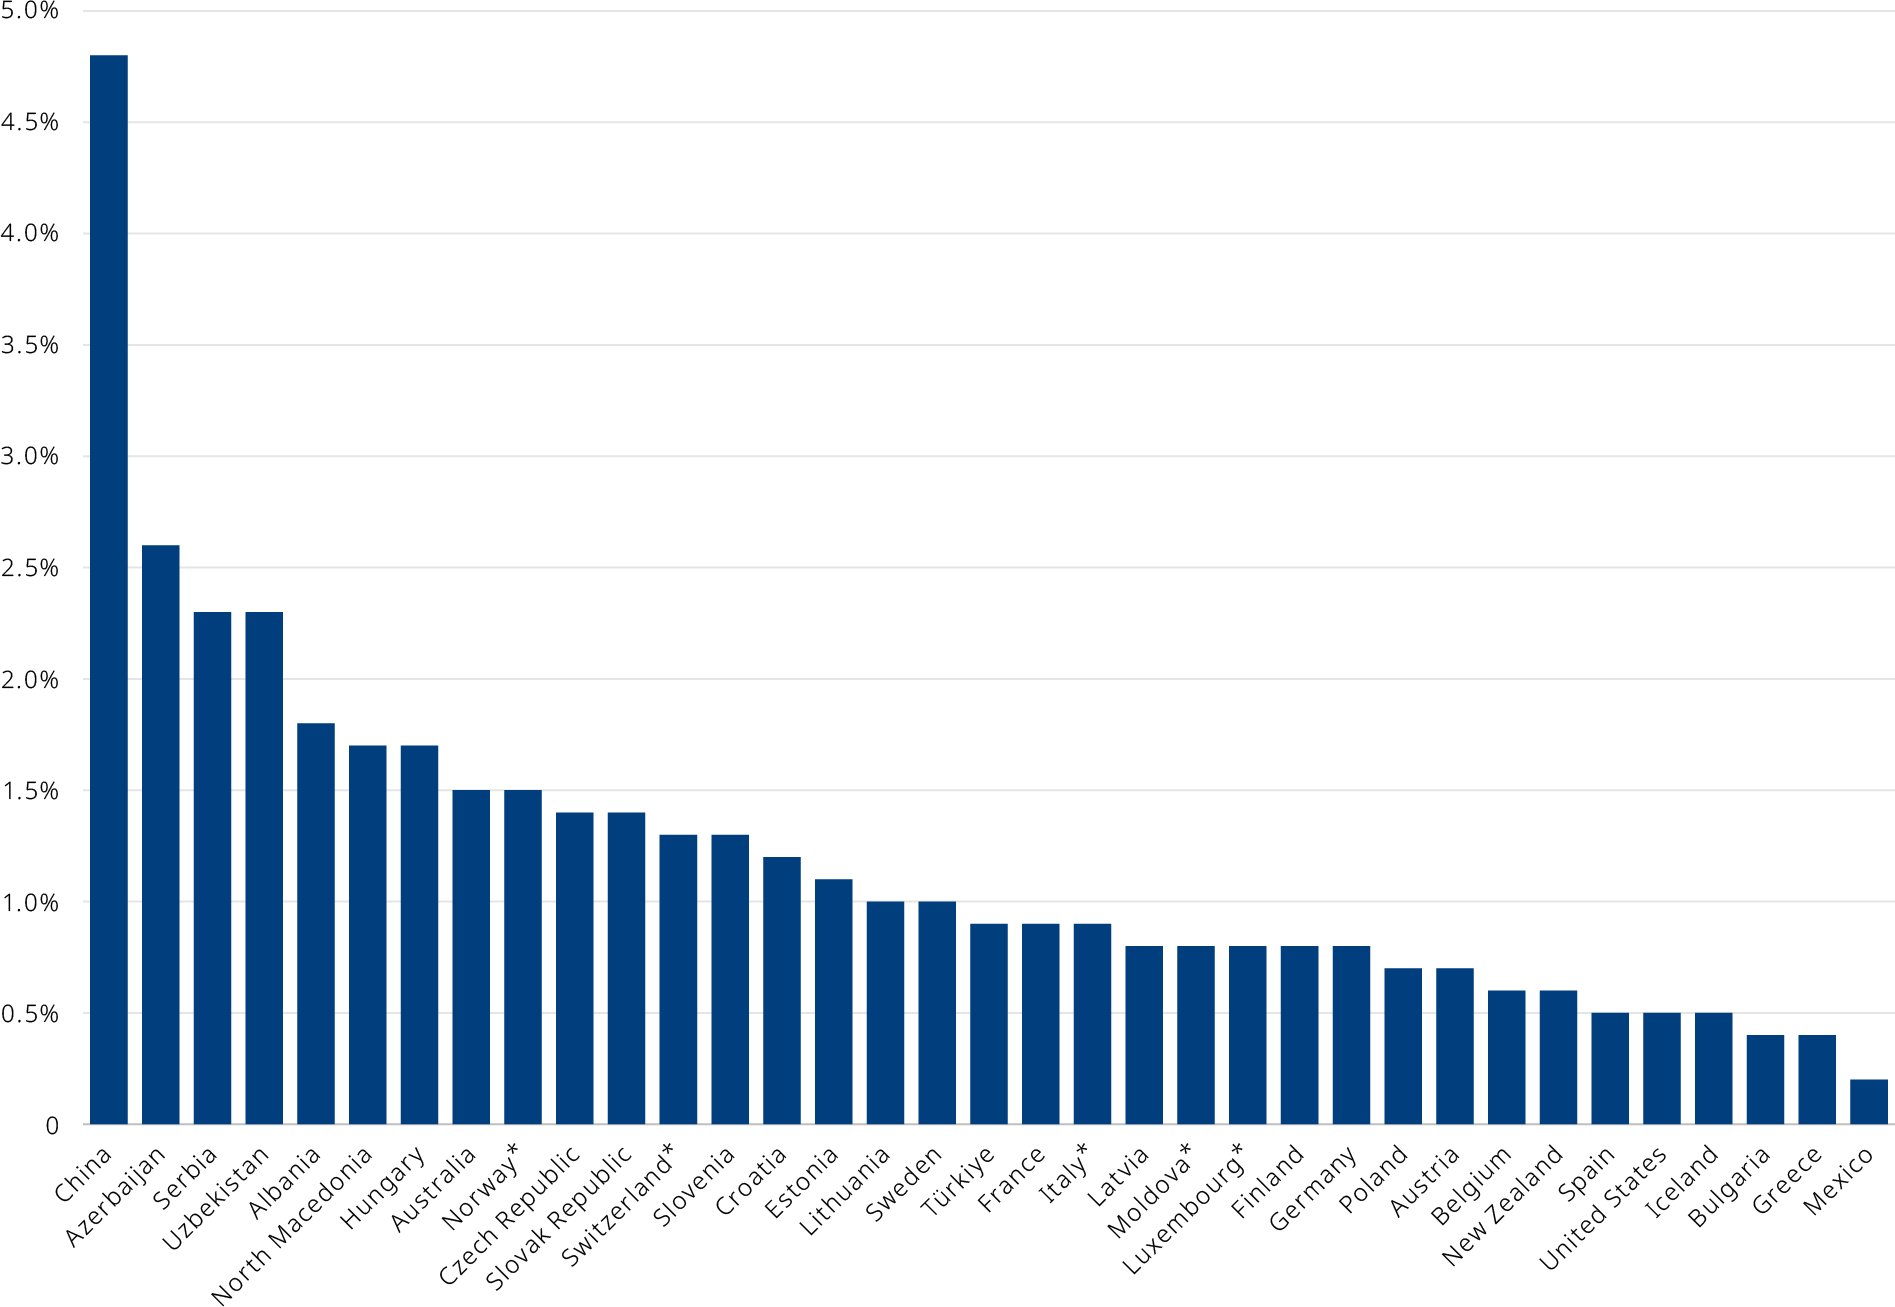
China is investing on a gigantic scale
China has long dominated global transport infrastructure investment. Its gigantic lead is borne out again by the latest data, warranting a closer look at the factors shaping China’s dominance and the implications for the future of global transport.
China’s dominance in transport infrastructure investment is driven by a growing economy, a high degree of industrialisation and fast urbanisation. Historically, China’s investment in transport infrastructure has been insufficient to support economic development, but domestic investment has greatly increased in the past decade.
In 2021 alone, a host of major infrastructure projects were completed or were nearing completion. More than 4 000 km of new railway lines were opened in 2021, and over 8 000 km of new highways were built. Around 1 000 km of high-grade waterways were added or improved. Seven new civil transport airports were certified, and the newly added operational mileage of urban rail transit exceeded 1 000 km. These examples from China’s 13th Five-Year Plan (2016-20) are part of an overall fixed asset investment drive of over USD 1.03 trillion for the transport sector. Over the plan’s span, China allocated 15% of its total transport investment to railways. Highways received 76%, with 3% earmarked for water transport. Civil aviation received around 5% of the investment budget.
Total inland investment spending as a percentage of GDP, 2021. *2020 data
Belt and Road Initiative powers transport investment
In 2013, China launched a global infrastructure development strategy, the Belt and Road Initiative. Since then, more than half of the investment by Chinese companies and financial institutions in countries that have signed co-operation agreements with China for the Belt and Road Initiative has gone to the transport and energy sectors. Investment in transport has increased from 16% of the total investment in Belt and Road projects in 2013 to 42% in 2020, slightly decreasing to around 32% in the first half of 2021.
Belt and Road transport infrastructure includes highways, railways, bridges, airports and ports. According to data from China’s Ministry of Commerce, in 2020, Chinese contractors completed infrastructure projects valued at USD 33 billion in counties outside China participating in the Belt and Road Initiative, accounting for 25.5% of the total sum spent. This was the largest area based on the total revenue of foreign contracted projects.
The importance of land links and the crucial role of highways
The relatively old infrastructure in many of the land-locked countries and regions in Central Asia participating in the Belt and Road Initiative sparked major investment in highways in a bid to step up economic development. Considered a comparatively efficient way to improve physical links, investing in highways is seen as critical for interconnectivity along land-based routes of the Belt and Road system.
Infrastructure projects for highways along the mainland-based corridors of the Belt and Road Initiative include the China-Mongolia-Russia Economic Corridor (See Map, Corridor 1), the China-Pakistan Economic Corridor (2), the Bangladesh-China-India-Myanmar Economic Corridor (3), and the China-Indochina Peninsula Economic Corridor (4).
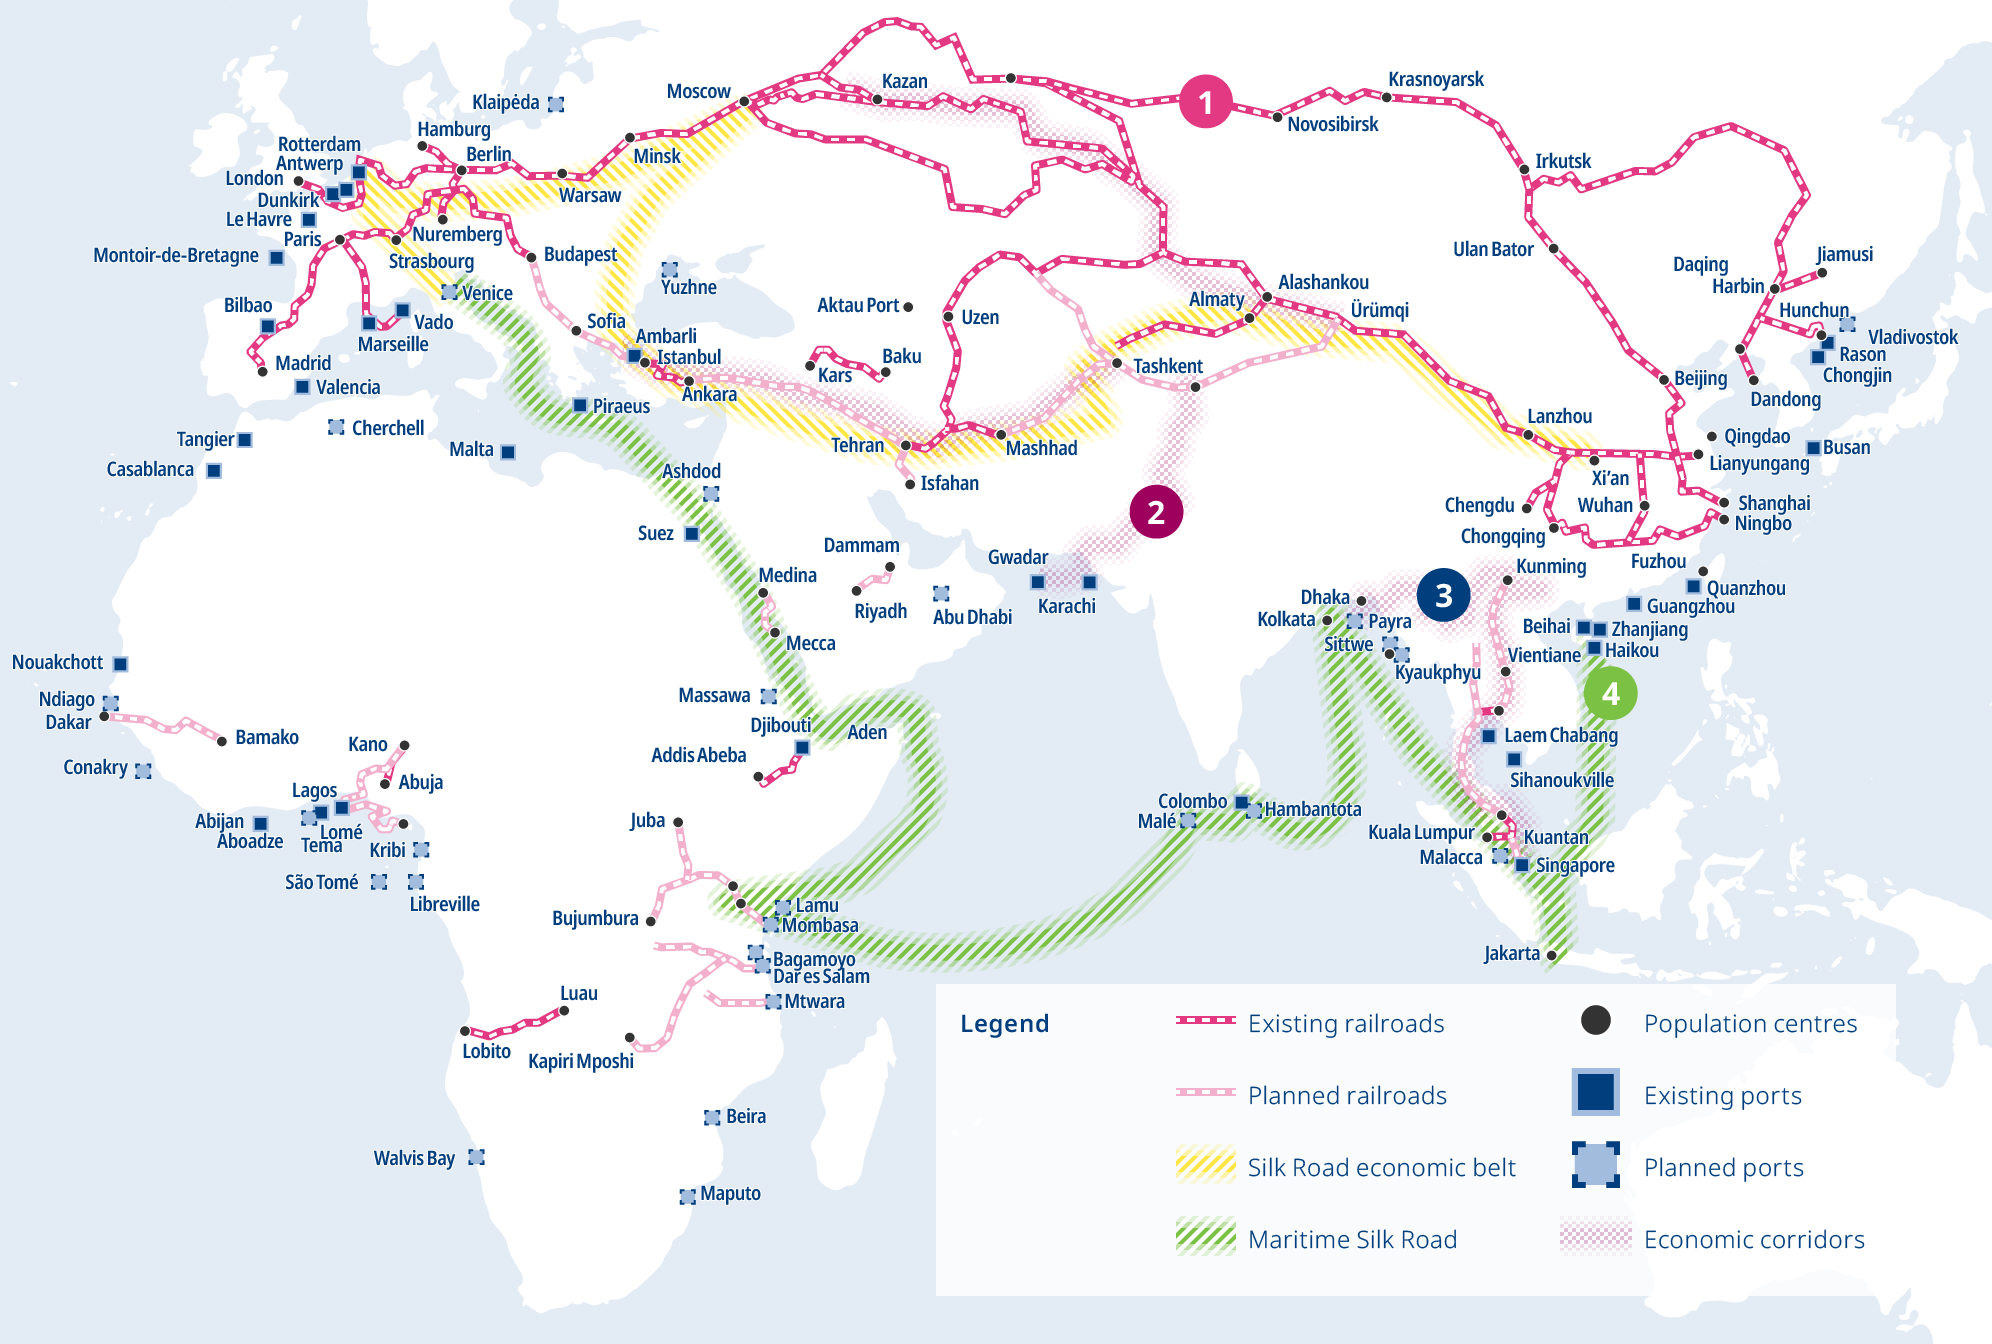
Source: OECD research from multiple sources, including: HKTDC, MERICS, Belt and Road Center, Foreign Policy, The Diplomat, Silk routes, State Council Information Office of the People’s Republic of China, WWF Hong Kong (China).
Ideas for change as spending on roads continues to dominate
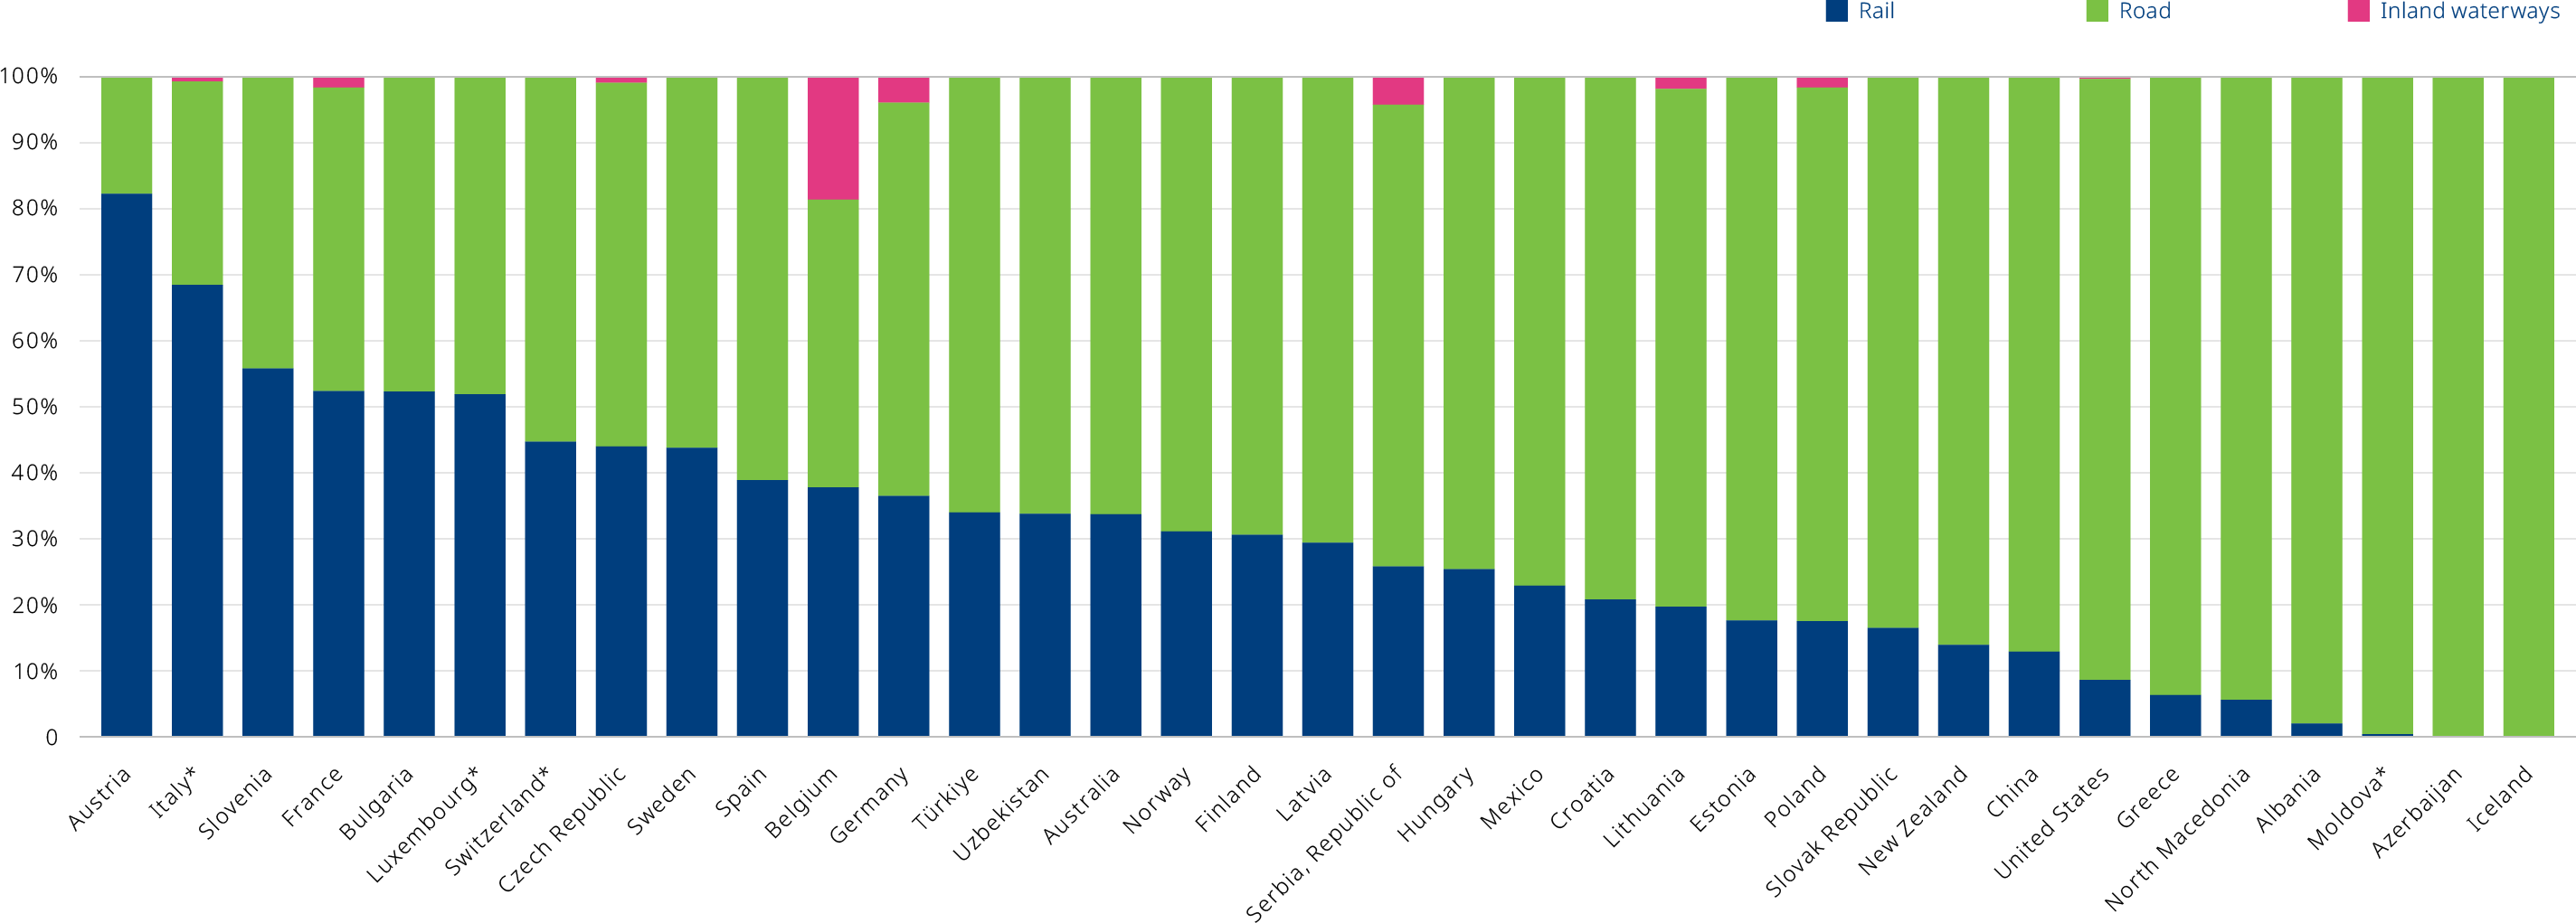
The 2021 data confirms road transport’s continued dominance of transport infrastructure spending. Only six countries have shifted more than half of their infrastructure spending towards rail: Austria, Italy, Slovenia, France, Bulgaria and Luxembourg (in order of magnitude).
The continued dominance of road infrastructure in national investment priorities is not in line with the need to decarbonise the transport sector and makes reaching the Paris Agreement goals even more challenging.
Percentage distribution of inland infrastructure spending by mode in 2021. *2020 data
Tipping the balance in favour of rail in Austria
In 2021, Austria spent 82% of its transport infrastructure investment on rail. In the same year, the share of freight transported by rail hit 51%. These shares give Austria a notable outlier position. The result of a long-term political vision underpinned by targeted policies shows that a combination of policies promoting rail coupled with targeted disincentives for other modes can achieve long-term policy objectives.
In 1974, Austria’s government issued a declaration citing the need to optimise accessibility and include all transport modes in a national transport strategy. By the late 1980s, the government further set an objective to shift transport demand to modes that optimised safety, economic benefits, environment and efficiency.
By 1987, the Central European nation had become the first country in Europe to make catalysts obligatory in private cars. To shift goods transport from the country’s roads to rail, Austria introduced restrictive speed limits for heavy-duty vehicles, forbade them to use specific routes during night hours, and increased the capacity for transporting trucks on railways – known as piggybacking – within Austria.
Tunnel vision for future freight
Transport policy became a critical factor in Austria’s negotiation for full EU membership, which was successfully completed in 1995. A collective agreement between Austria and the EU (the “Transitvertrag”) capped the number of heavy-duty vehicles passing between Austria and Italy via the Brenner Pass to restrict emissions caused by trucks on what is considered an environmentally sensitive route.
Discussions on alternatives to this vital road route led to the construction of the 64 km Brenner Base Rail Tunnel. The longest underground railway connection in the world, due for completion in 2032, will become part of Line 1 of the Trans-European Transport Networks (TEN-T). The project aims to reduce travel between Innsbruck and Fortezza from 80 to 25 minutes, making the rail link more competitive and resulting in an estimated modal shift from road to rail of up to 22.7 million tonnes of freight and 5.3 million passengers per year.
About the statistics
Download the Statistics Brief as a visual PDF
The ITF statistics on investment, maintenance expenditure and capital value of transport infrastructure for 1995-2021 are based on a survey sent to current ITF member countries. The survey covers total gross investment (defined as new construction, extensions, reconstruction, renewal and major repair) in road, rail, inland waterways, maritime ports and airports, including all sources of financing. It also covers maintenance expenditures financed by public administrations and the capital value of transport infrastructure. Inland infrastructure investment covers rail, road and inland waterways transport modes.
The ITF Secretariat collects data from member countries in national currencies, which are then converted to current prices and constant euros. Significant efforts have been devoted to collecting relevant deflators needed to calculate the constant Euro equivalent of data provided, since no purchasing power parity corrected general index exists for transport infrastructure investment.
Where available, a cost index for construction on land and water is used. Where these indices are not available, a manufacturing cost index or a GDP deflator is used.
Detailed country data for inland modes, maritime ports and airports, more detailed data descriptions and notes on the methodologies are available at:
https://stats.oecd.org/Index.aspx?DataSetCode=ITF_INV-MTN_DATA
The data in this Statistics Brief are as of 15 June 2022. Online datasets can be updated following countries’ revisions.
The International Transport Forum at the OECD is an intergovernmental organisation with 66 member countries. It acts as a think tank for transport policy and organises the Annual Summit of transport ministers. The ITF is the only global body that covers all transport modes. It is administratively integrated with the OECD, yet politically autonomous.
© OECD/ITF 2023.
Disclaimer
The opinions expressed and arguments employed herein do not necessarily reflect the official views of the member countries of the ITF. This document, as well as any data and map included herein, are without prejudice to the status of or sovereignty over any territory, to the delimitation of international frontiers and boundaries, and to the name of any territory, city or area.
Date of Publication: 17 July 2023
Further information: Xiaotong Zhang
