Modal shift to cleaner transport fails to materialise
Global transport data from 2010 to 2021 collected by the International Transport Forum show the following:
- Passenger and freight transport demand steadily increased from 2010 until early 2020 following the outbreak of Covid-19.
- Economic growth is one of the most significant drivers of transport demand between 2010 and 2021.
- Inland freight transport does not show a shift to more sustainable modes.
- Sea transport accounts for the largest share of containerised freight.
- The pandemic heavily affected rail passenger transport in Europe, which dropped 51% between 2019 and 2021.
- Road passenger transport was less impacted by the pandemic than rail.
- The share of passenger transport by car increased for all reporting countries between 2010 and 2021.
Subscribe to ITF Statistics Briefs
Growing transport demand from 2010 up until the pandemic
Inland freight transport demand in Australia, Europe, and transition economies continuously increased over the last decade. In 2021, inland freight transport grew by 54% in Australia, 15% in Europe, and 26% in transition economies compared to 2010. The onset of Covid-19 did not significantly impact inland freight transport in Australia and Europe. Inland freight transport continued growing in 2020. In 2021, it was higher by 3% in Australia and by 2% in Europe compared to 2019. By contrast, transition economies' freight transport decreased by 4% in 2020 compared to 2019 but recovered in 2021 to be 3% above the pre-pandemic level in 2019.
Containerised freight transport grew significantly during the last decade, especially in transition economies compared to Europe. The pandemic did not disrupt the growing trend of containerised freight in transition economies. In Europe, however, the pandemic caused a drop of 5% between 2019 and 2020. Nevertheless, by 2021, containerised freight volume was 47% higher in Europe and 93% higher in transition economies compared to 2010.
Inland passenger transport was significantly impacted in Europe and in transition economies in 2020 after one decade of constant growth. The Covid-19 pandemic severely disrupted the European passenger transport sector in 2020, reducing passenger travel demand to below 2010 levels. In transition economies, passenger transport fell by 17% in 2020 compared to 2019, although this was still above 2010 levels. Data for 2021 show that inland passenger transport was 9% lower in Europe and 44% higher in transition economies compared to 2010 (Figure 1).
Figure 1. Transport demand growth by sector and region (2010=100)
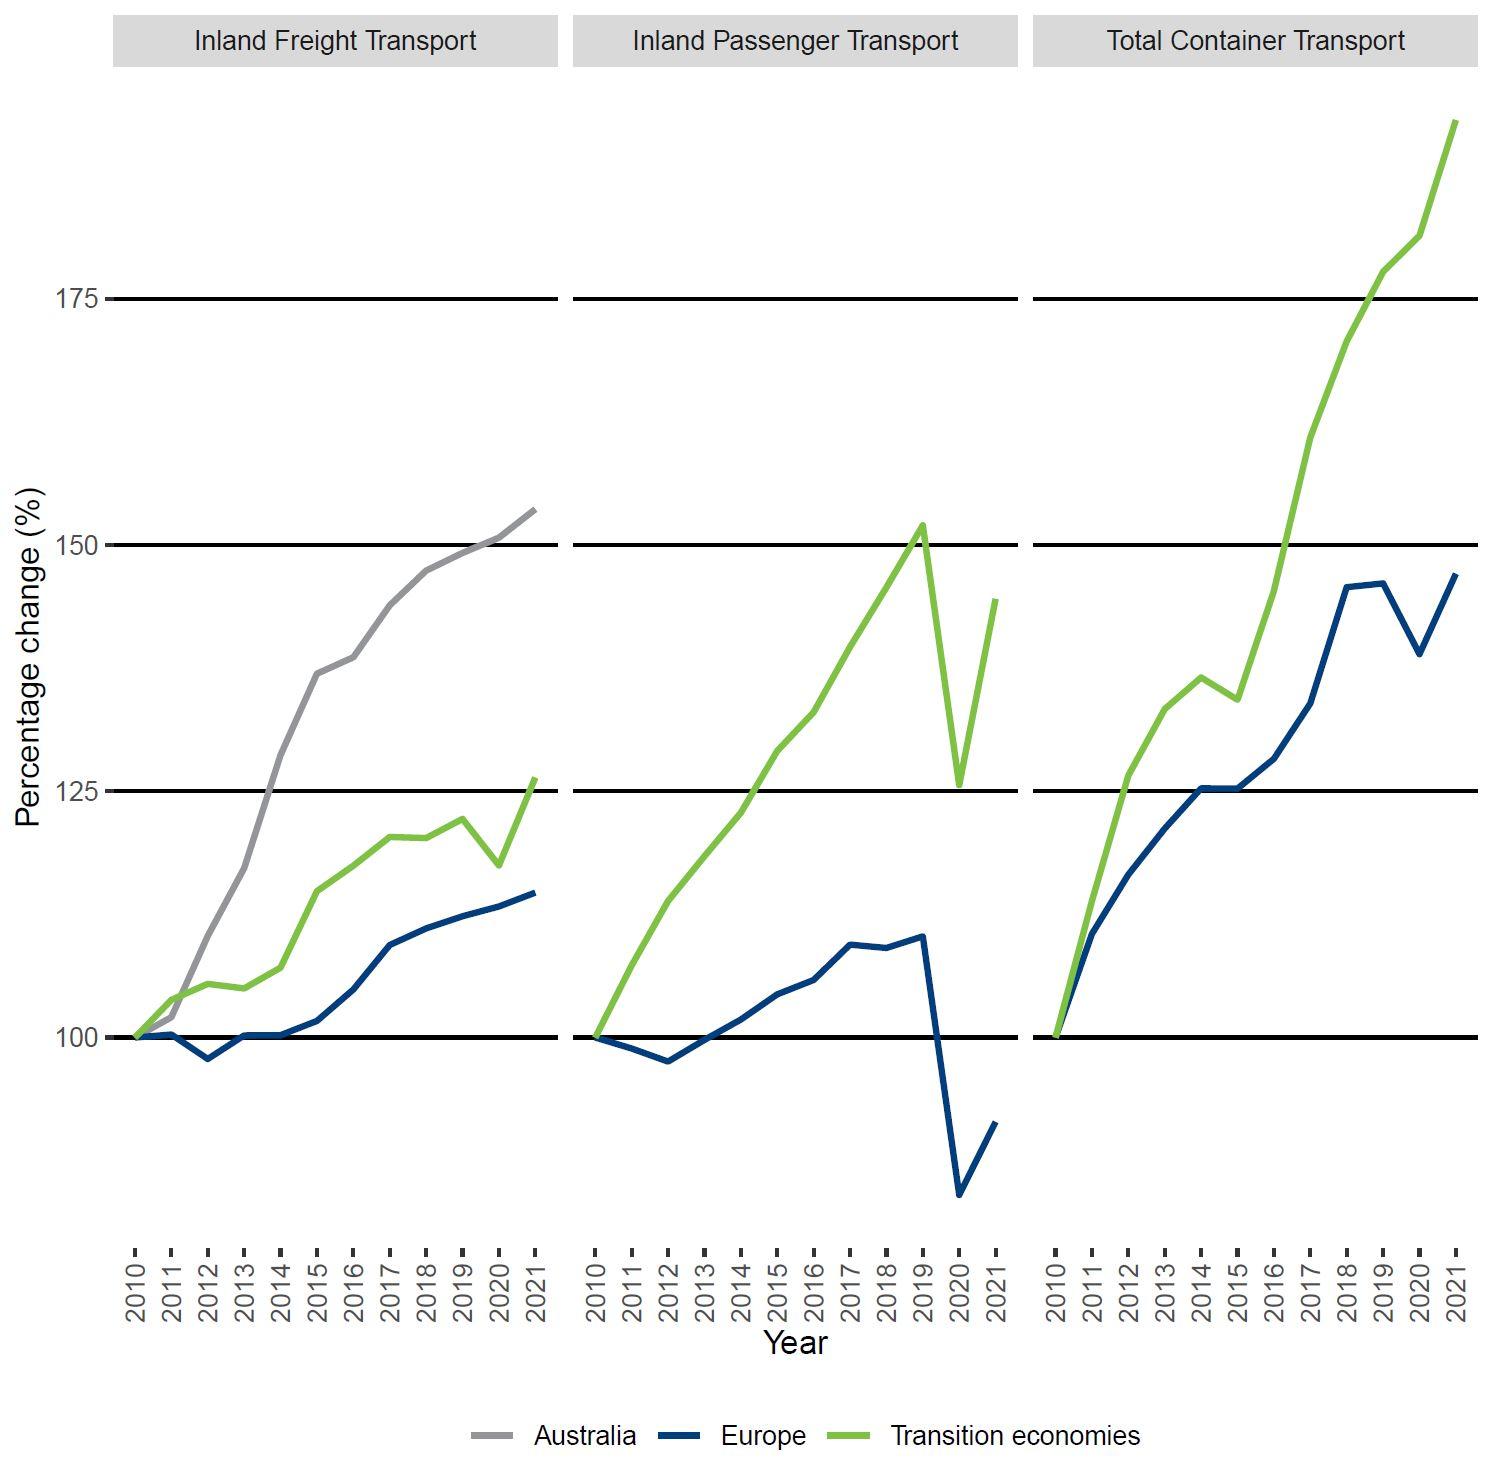
Note: This Figure is built using the latest data available in the Transport Measurement dataset. For this reason, not all regions are included in each panel. The country composition in each region may vary. 1) Inland Freight Transport. Europe: Austria, Bulgaria, Croatia, Czech Republic, Estonia, Finland, France, Germany, Greece, Hungary, Ireland, Italy, Latvia, Lithuania, Netherlands, Norway, Poland, Slovakia, Slovenia, Sweden. Transition Economies: Azerbaijan, Mexico, Moldova, North Macedonia, Türkiye. 2) Inland Passenger Transport. Europe: Czech Republic, Finland, France, Hungary, Italy, Norway, Poland, Sweden. Transition Economies: Azerbaijan, Georgia, North Macedonia, Türkiye. 3) Total Container Transport. Europe: Austria, Bulgaria, Croatia, Czech Republic, Germany, Estonia, France, Finland, Greece, Hungary, Ireland, Italy, Latvia, Lithuania, Netherlands, Norway, Poland, Slovakia, Slovenia, Sweden, Switzerland. Transition economies: Albania, Azerbaijan, Georgia, Israel, Moldova, Türkiye.
Economic growth drives demand for transport
An increase in economic activity boosts the movement of goods and people. ITF empirical research shows a statistically-significant positive correlation between gross domestic product (GDP) and container transport, inland passenger and freight transport, respectively. Modelling by ITF demonstrates the same positive correlations between per-capita GDP and transport demand.
Road crash fatalities decrease despite growth in transport
Deaths fromroad crashes fell in Europe, OECD Pacific countries and transition economies between 2010 and 2021. Crash fatalities increased in North America overall, with a decrease in Canada of 21% and USA recording an increase of 30%. The Covid-19 pandemic accentuated the drop in road fatalities due to travel restrictions imposed in many countries. In 2021, fatalities fell by 33% in Europe, 42% in OECD Pacific countries and 28% in transition economies compared with 2010 (Figure 2).
Economic growth and road crash fatalities move in tandem when no specific road safety measures are taken. Panel data regression analysis confirms the positive correlation between road crash fatalities and GDP growth while isolating country-specific fixed effects like policy interventions on road safety. Research by the ITF's International Traffic Safety Data and Analysis Group (IRTAD) also confirms this relationship. In its 2015 study, the group concluded that severe economic downturns, like the global financial crisis of 2008-09, are invariably followed by a marked drop in road crash fatalities. Countries must introduce effective road safety policies in order to decouple economic growth and road fatalities.
Figure 2. Road crash fatalities: trends by region (2010=100)
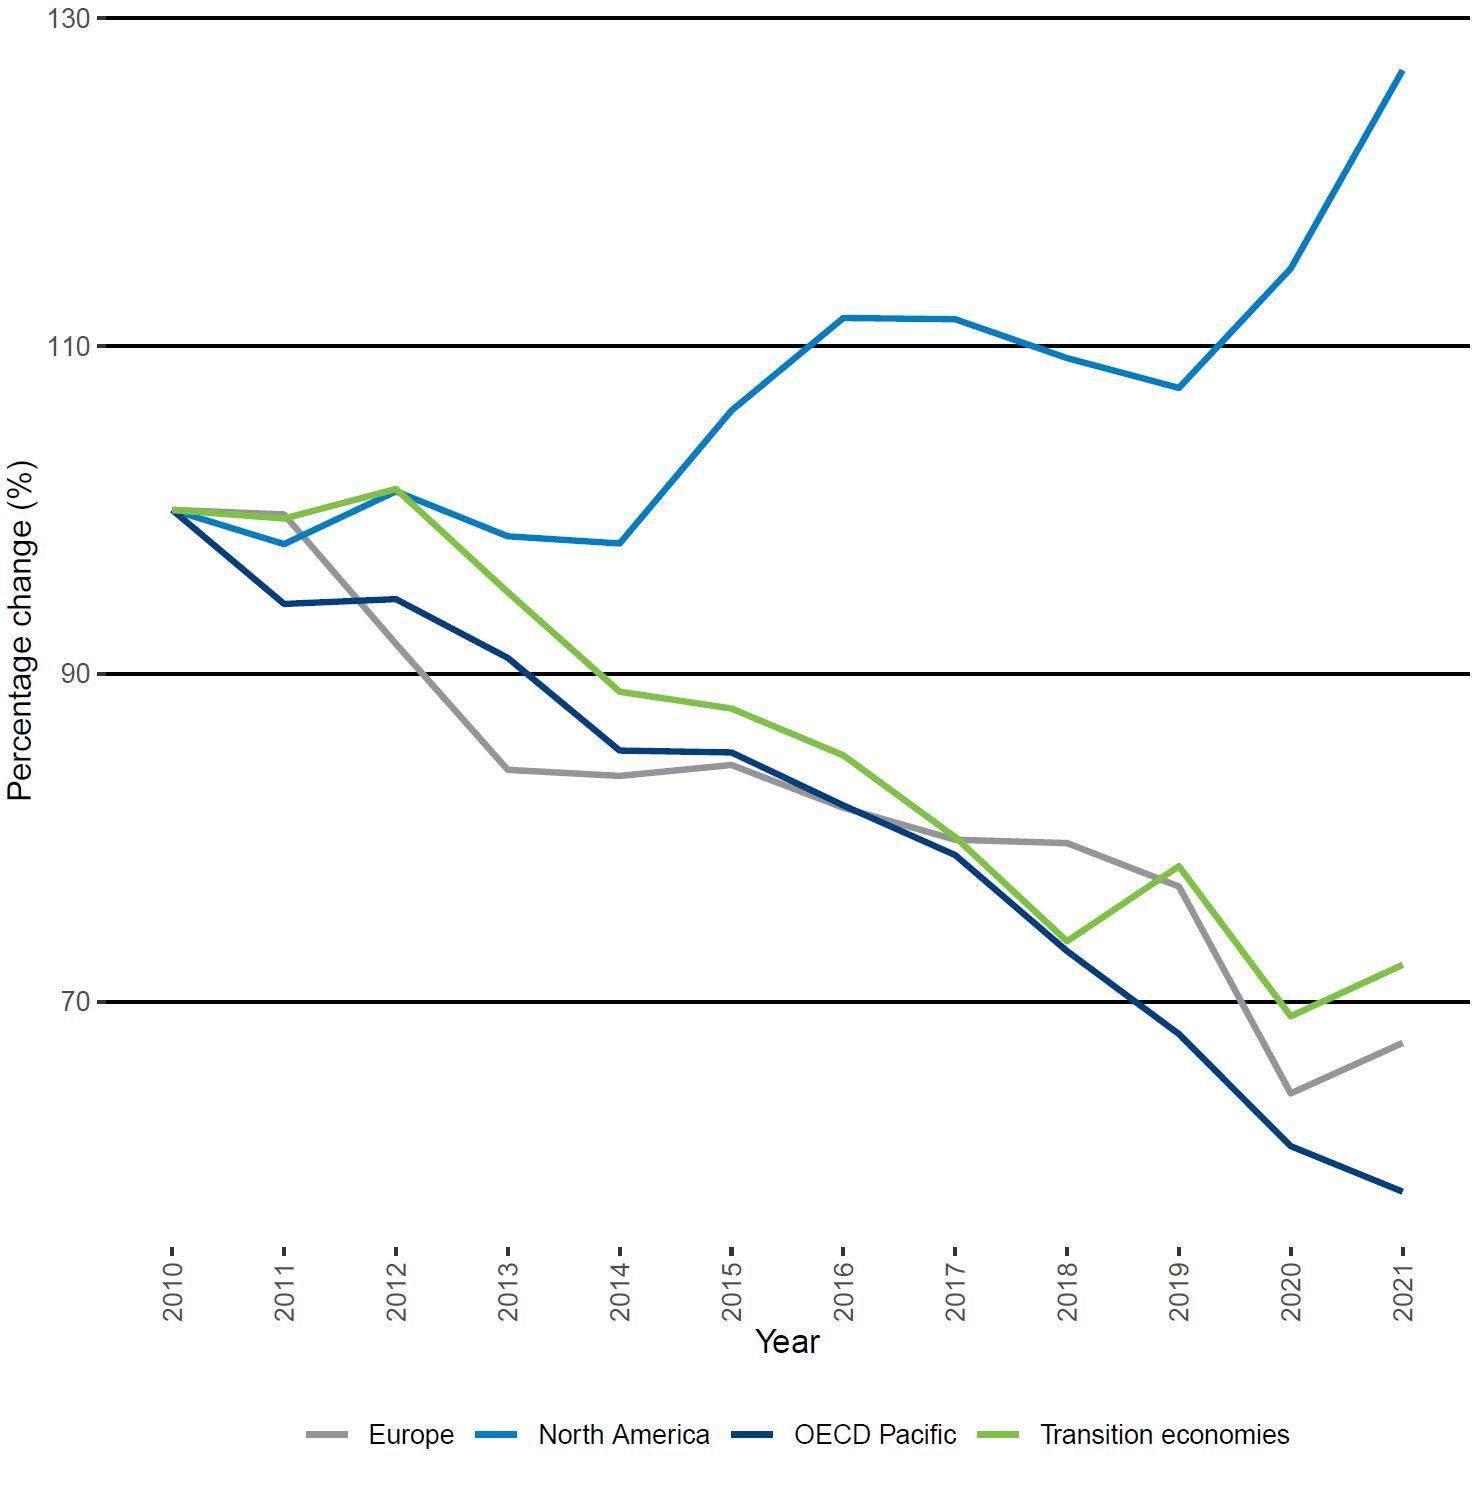
Note: This Figure was built considering the latest data available in the Transport Measurement dataset. For this reason, not all countries could be included in the analysis. Europe: Austria, Bulgaria, Croatia, Czech Republic, Germany, Estonia, Finland, France, Greece, Hungary, Iceland, Ireland, Italy, Latvia, Lithuania, Netherlands, Norway, Poland, Slovakia, Slovenia, Sweden, Switzerland. North America: Canada, United States of America. OECD Pacific: Australia, Japan, Korea, New Zealand. Transition Economies: Albania, Azerbaijan, Georgia, Israel, Moldova, North Macedonia, Serbia.
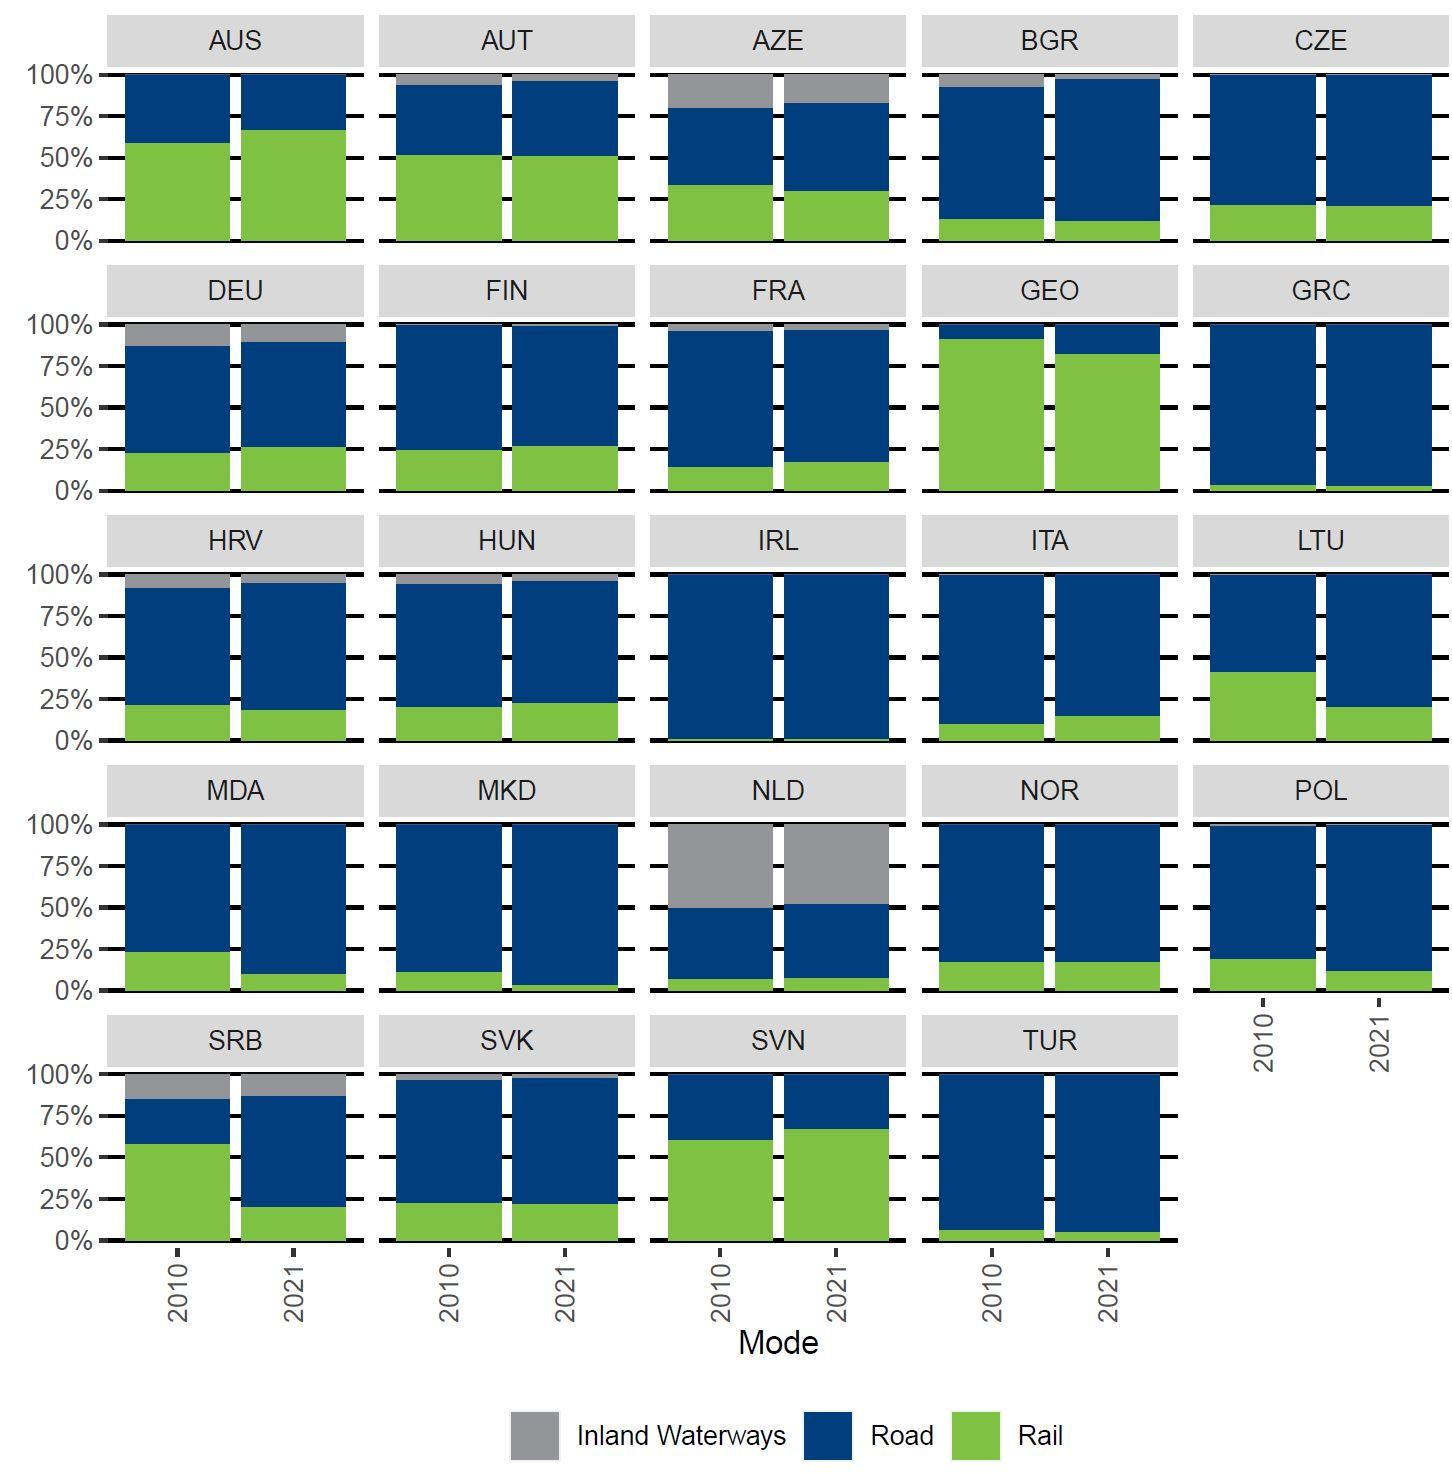
Freight shift to road jeopardises climate goals
Despite the general stability in the modal share of inland freight transport across ITF member countries, the 2021 data show some noticeable differences from 2010. A few countries increased their use of rail to transport freight, most notably Australia (+8%), Slovenia (+7%) and Italy (+5%), shifting from road transport. Other countries with an increased share of rail freight are Finland, France, Germany and Hungary. Most countries that experienced an inland freight modal shift show an increase in the use of road transport, however. Serbia (+40%), Lithuania (+21%) and Moldova (+13%) are the top three countries with the highest shift towards road transport, reducing their shares of rail and inland waterways use. The remaining countries have also increased the use of trucks on average by 4% (Figure 3).
The increasing use of road transport over the railway in most countries translates into more carbon dioxide (CO2) emissions, hindering global climate efforts. ITF’s Transport Climate Action Directory shows that improving vehicle fuel efficiency and adopting new, zero-emission vehicle technologies can be the first steps in reducing emissions from the freight transport sector. Promoting mode shift from road to rail is also an effective policy since the emissions intensity of rail freight is nearly ten times lower than that of trucks (per tonne-kilometre).
Figure 3. Mode shares of inland freight transport (excluding oil pipelines)
(share of tonne-kilometres by mode)
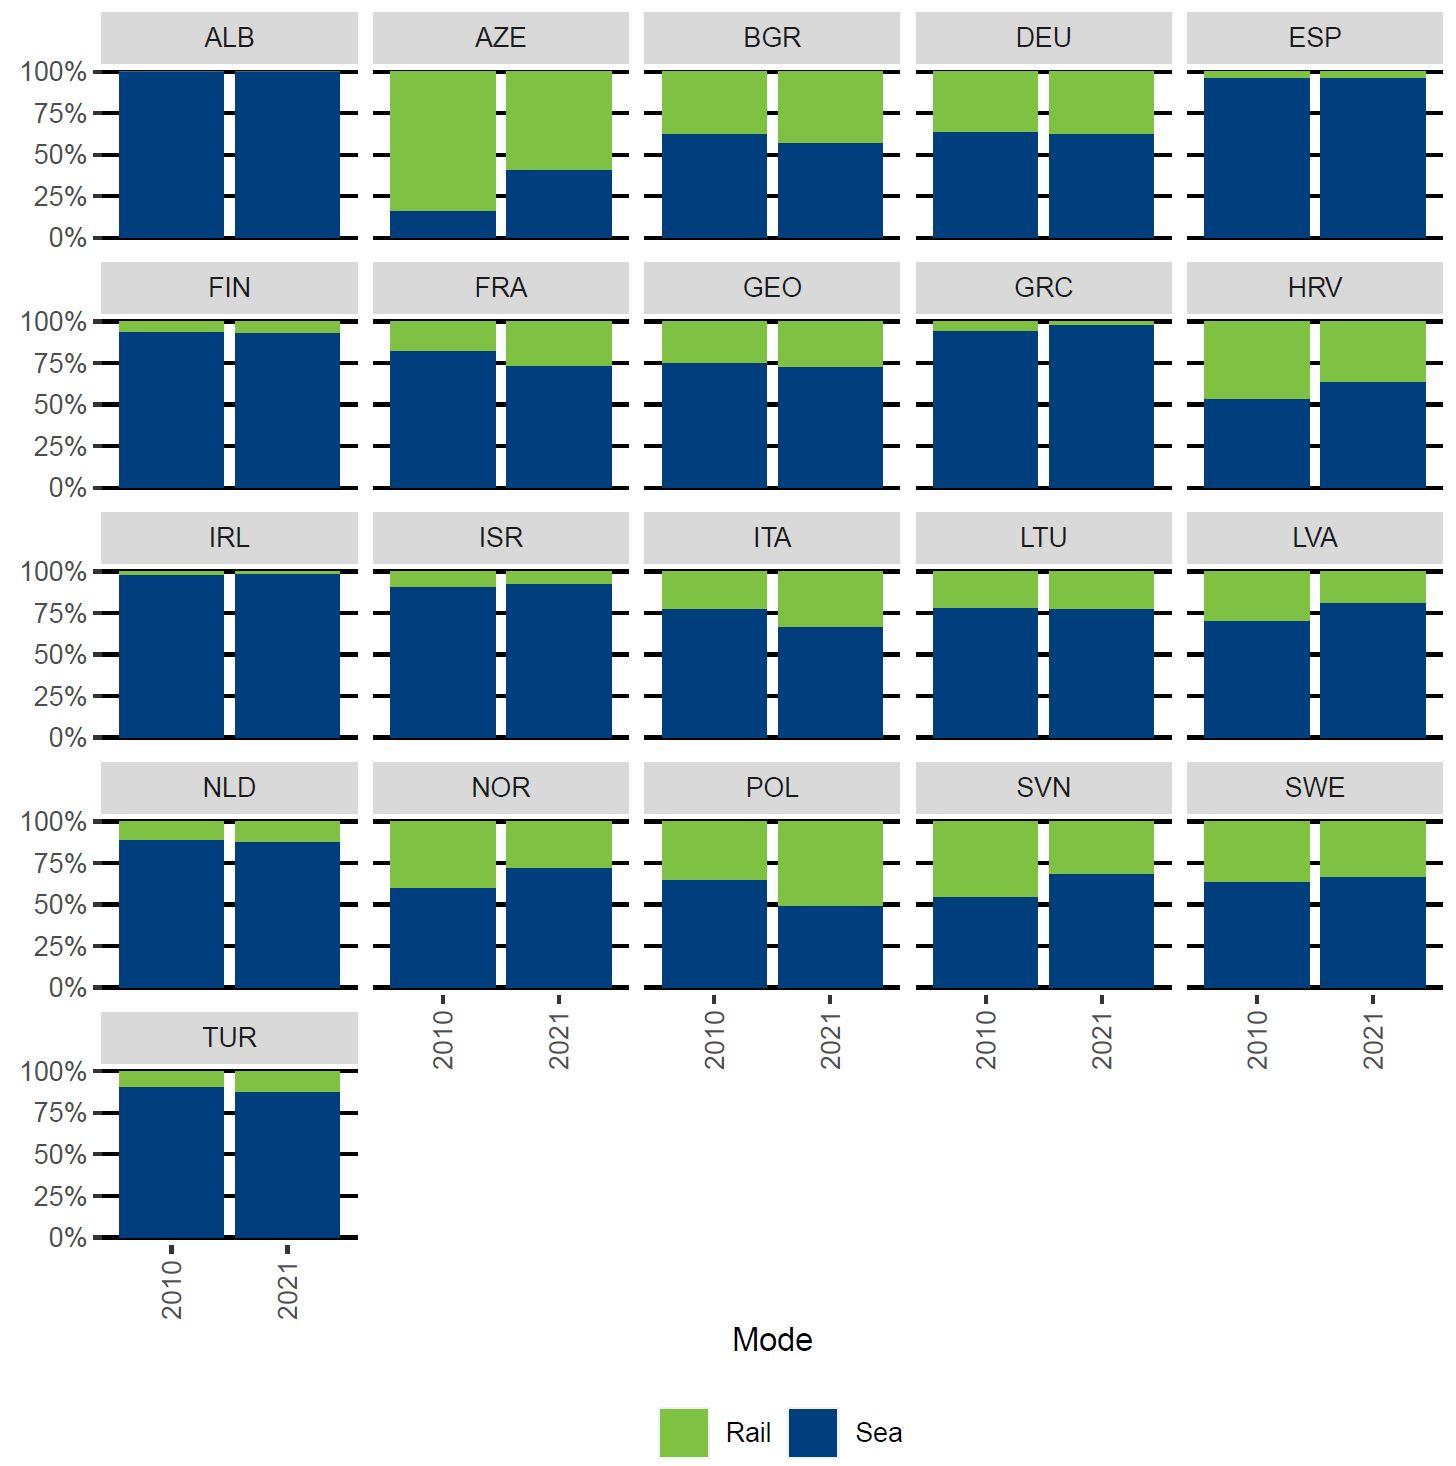
Sea transport accounts for the largest share of containerised freight
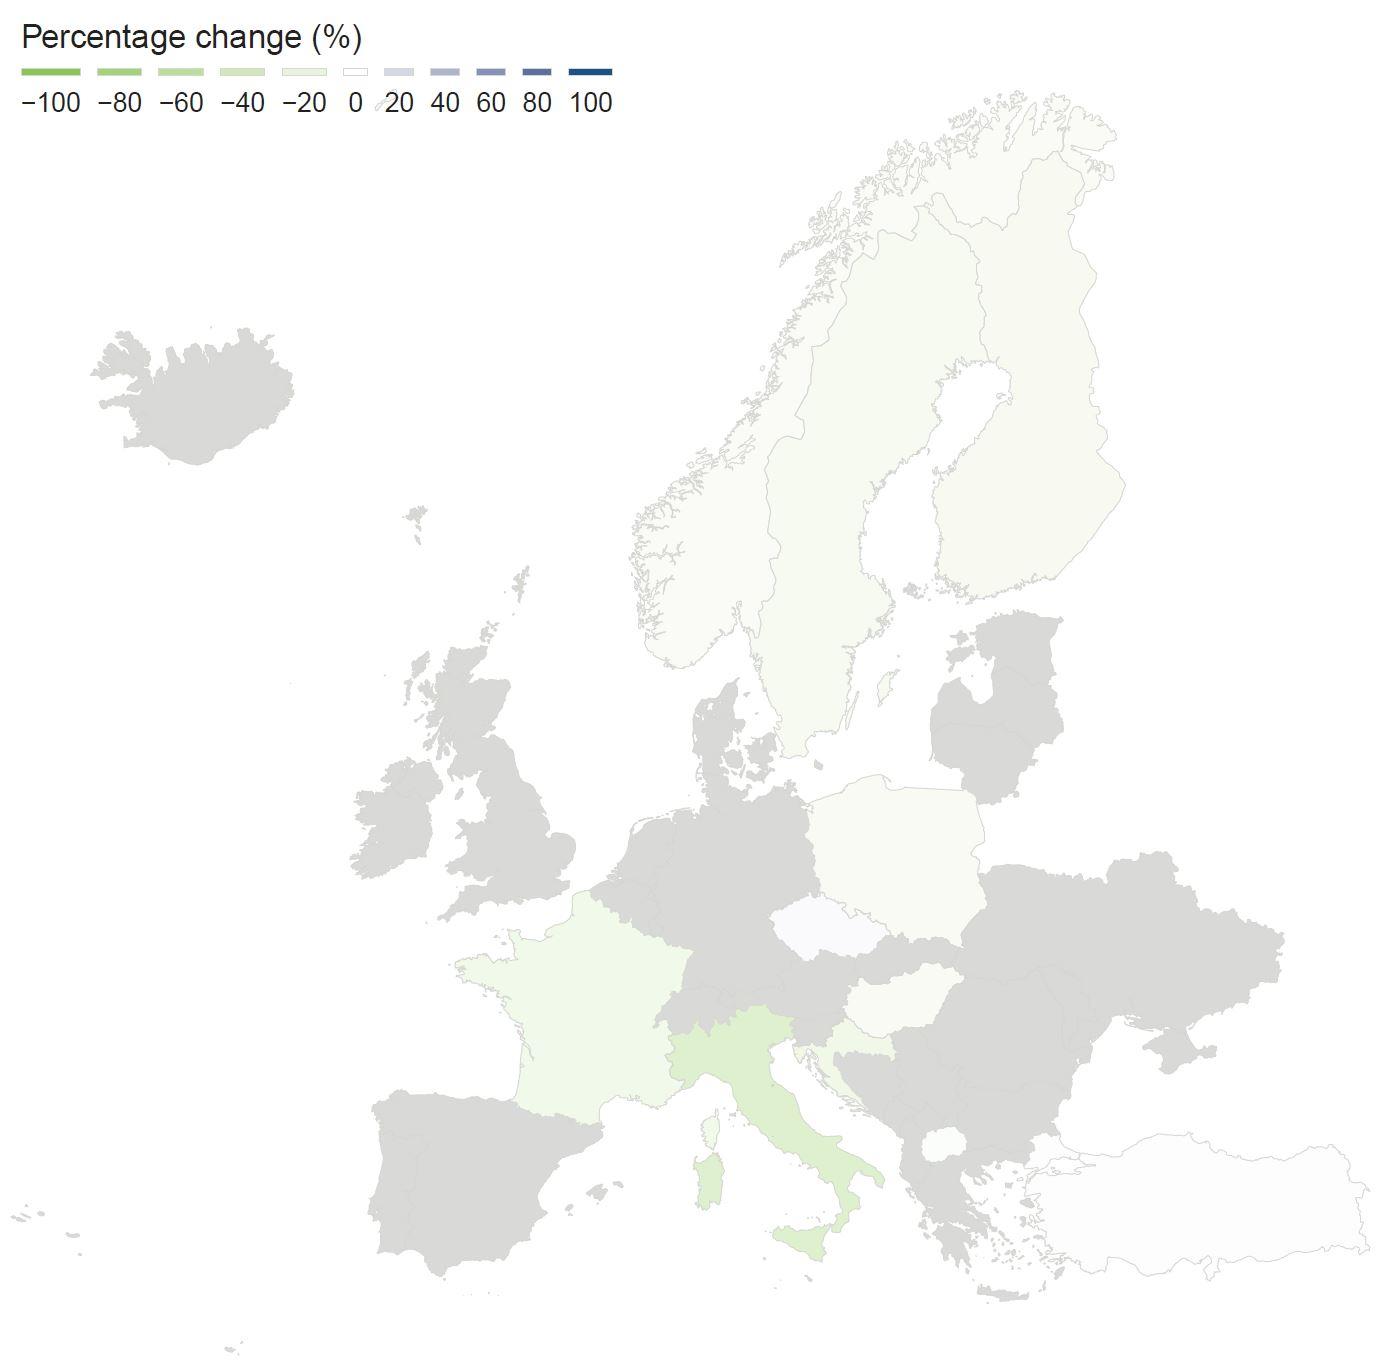
Rail container transport grew significantly during the last decade in Europe and transition economies, increasing by 59% in Europe and more than doubling in transition economies. Sea container freight experienced smaller but sizeable gains from 2010 to 2021: in Europe, it increased by 42%, while transition economies experienced growth of 89%. Ten countries saw an increase in the share of transport by sea: Azerbaijan (+25%), Slovenia (+14%) and Norway (+12%). The other 11 countries had an increased share of rail, with the most remarkable gains in Poland (+15%), Italy (+11%) and France (+9%) (Figure 4).
Figure 4. Share of total container transport by mode
(share of tonnes by mode)
Covid-19 sees European rail passenger transport drop 51%
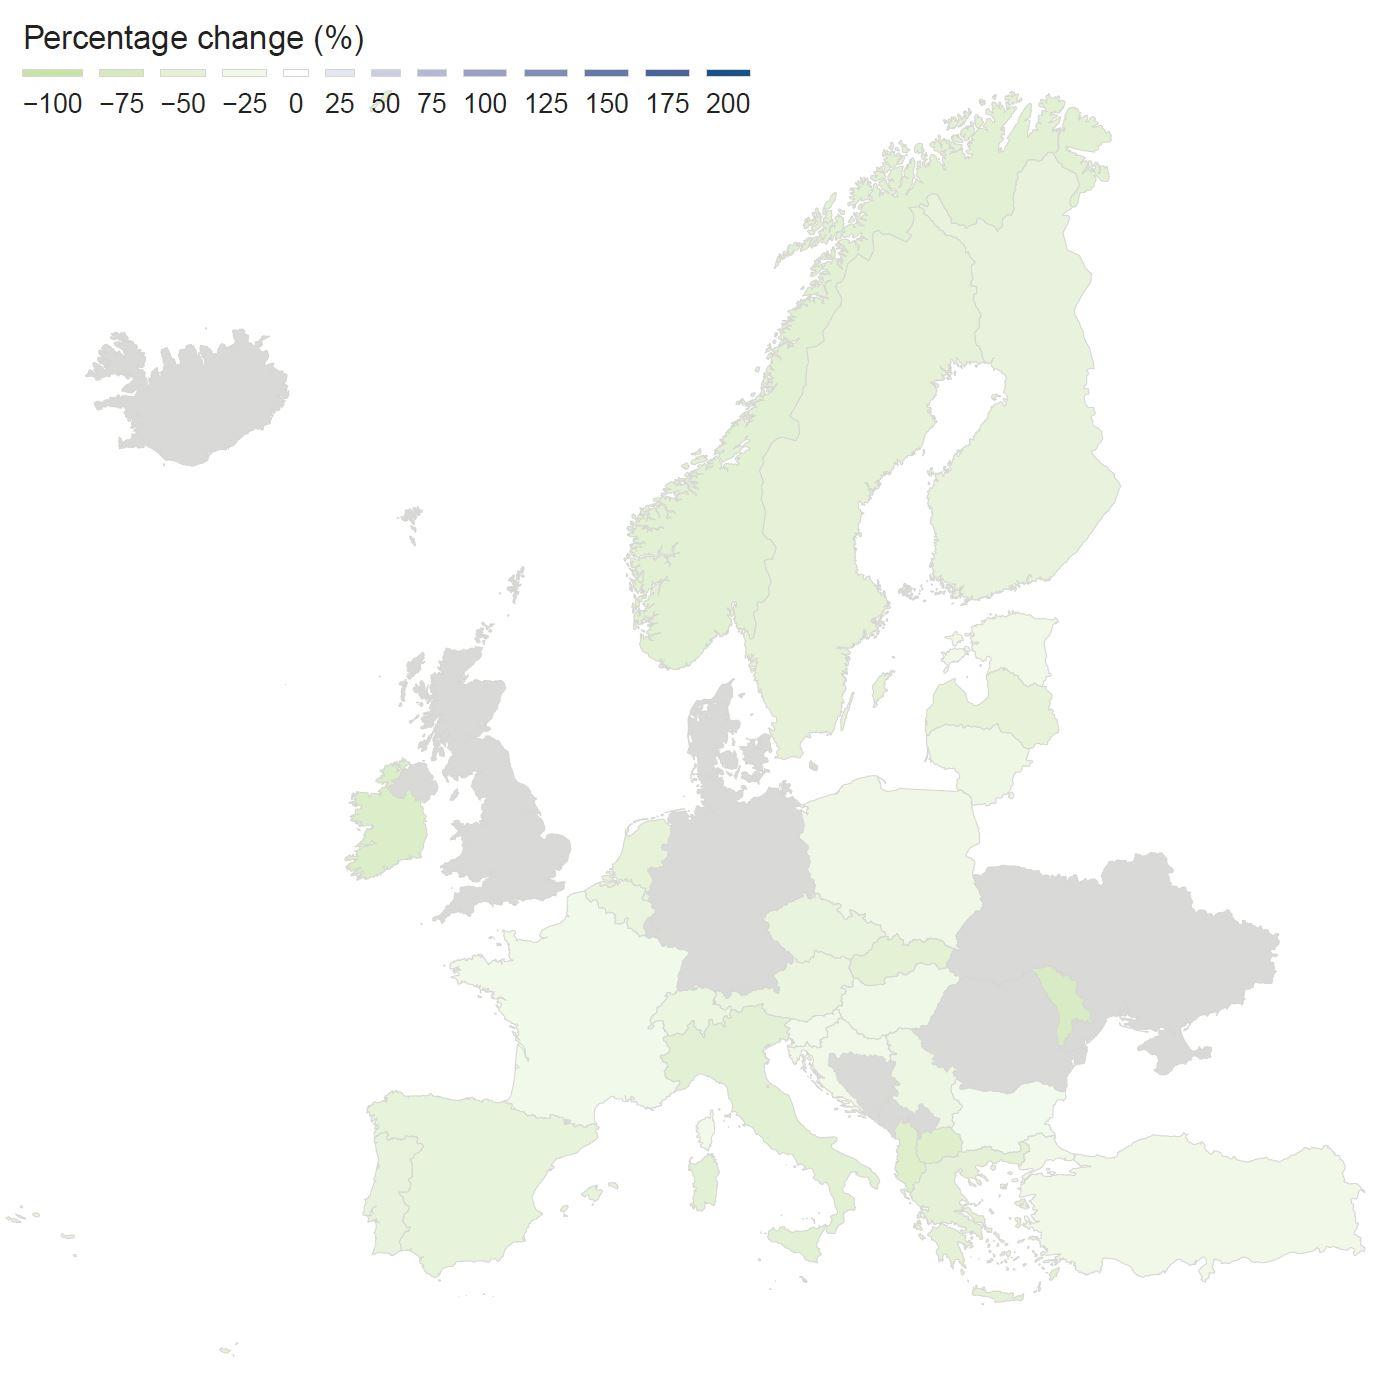
Prior to the Covid-19 outbreak, rail passenger numbers in most European countries and Türkiye increased significantly. Türkiye (+155%), Slovakia (+77%) and the Czech Republic (+66%) recorded the most significant gains in the region from 2010 to 2019. By contrast, many reporting countries, including the Balkan countries, Latvia, Moldova and Ukraine, have experienced a contraction of rail use since 2010.
It is possible to observe the effects of numerous lockdowns and self-isolating measures on rail transport due to the Covid-19 pandemic by comparing passenger transport between 2019 and 2021. The most affected countries during the pandemic were Moldova (-69%), Ireland (-64%), and Albania (-59%), while the least affected countries were Bulgaria (-21%), Slovenia (-22%), and France (-23%).
In 2021, only Türkiye (+91%), Estonia (+17%) and the Czech Republic (+4%) has rail passenger numbers above 2010 levels. All other reporting countries plummeted below 2010 levels. Countries that experienced relatively significant gains up to 2019, like the Czech Republic and Slovakia, returned to 2010 levels during the second year of the pandemic. This was mainly due to the fact that the second Covid-19 wave in early 2021 and the Omicron wave at the end of 2021 forced most governments to implement new lockdowns (Figure 5).
Figure 5. Europe and Türkiye changes in rail passenger use
Figure 5a. Percentage change between 2010 and 2019 (pre-pandemic)
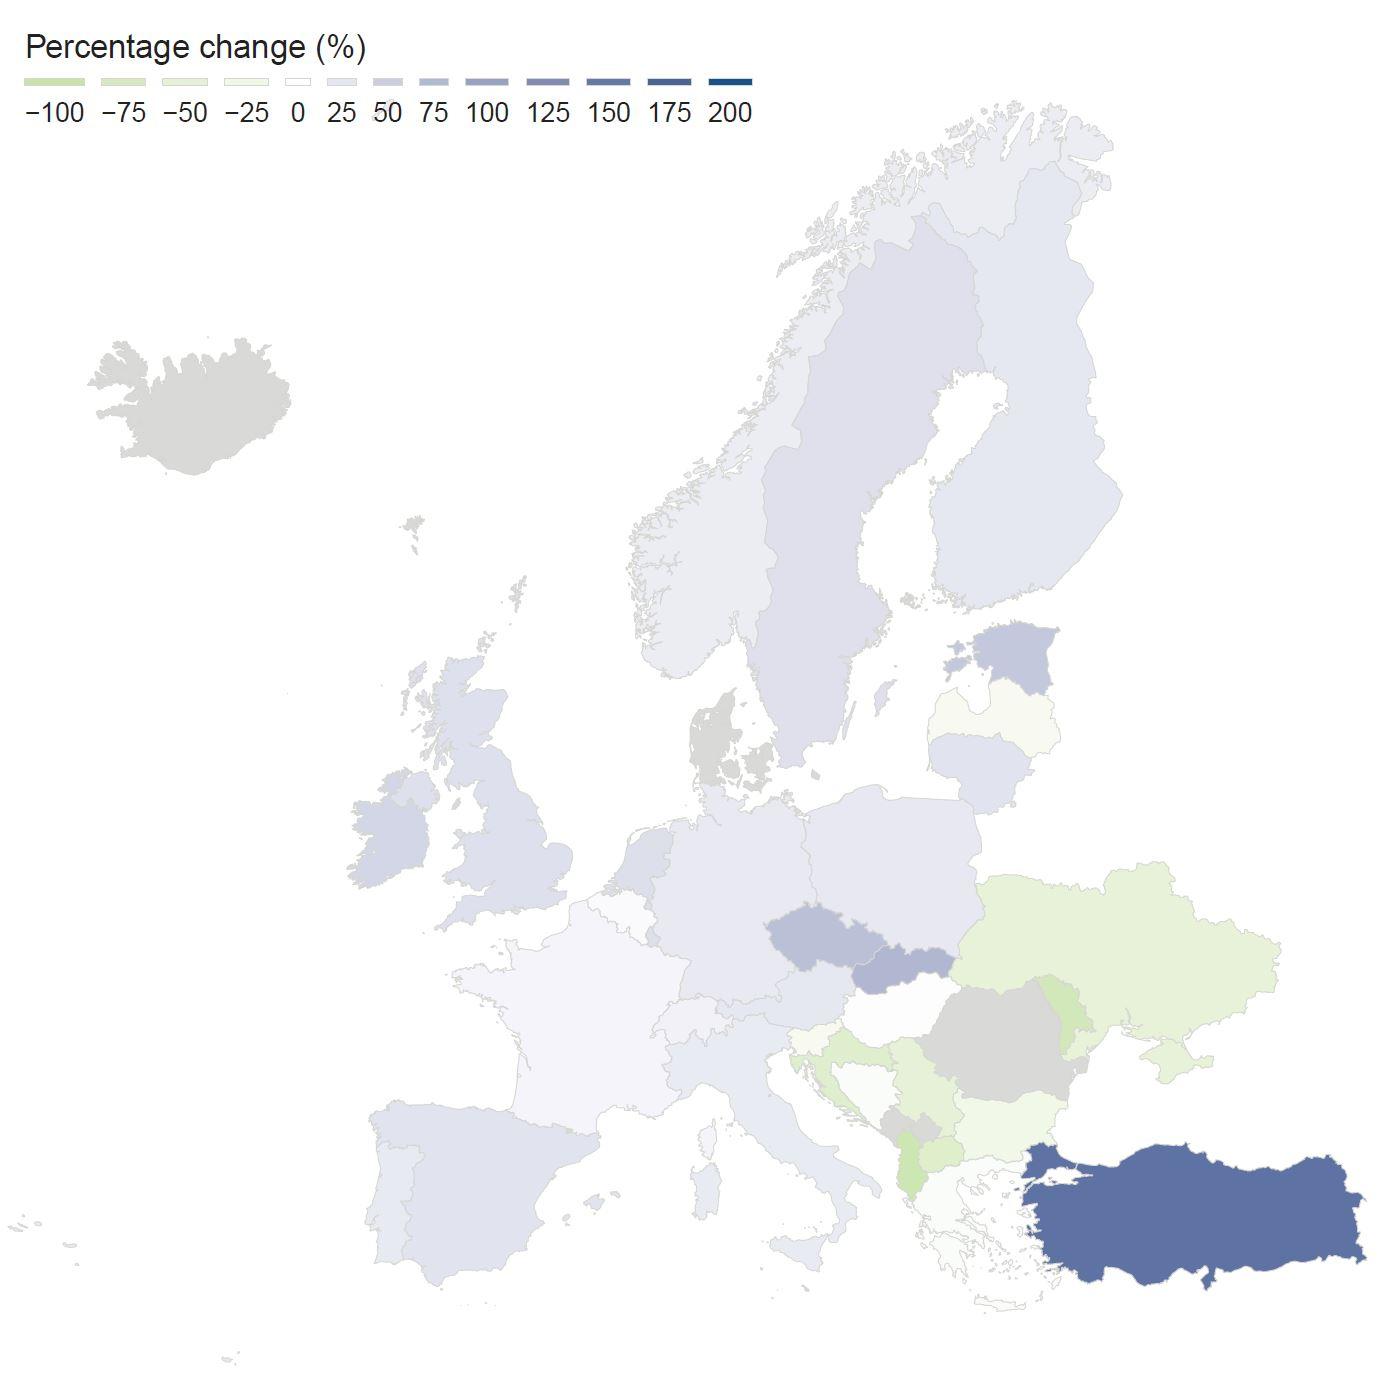
Figure 5b. Percentage change between 2010 and 2021 (post-pandemic)
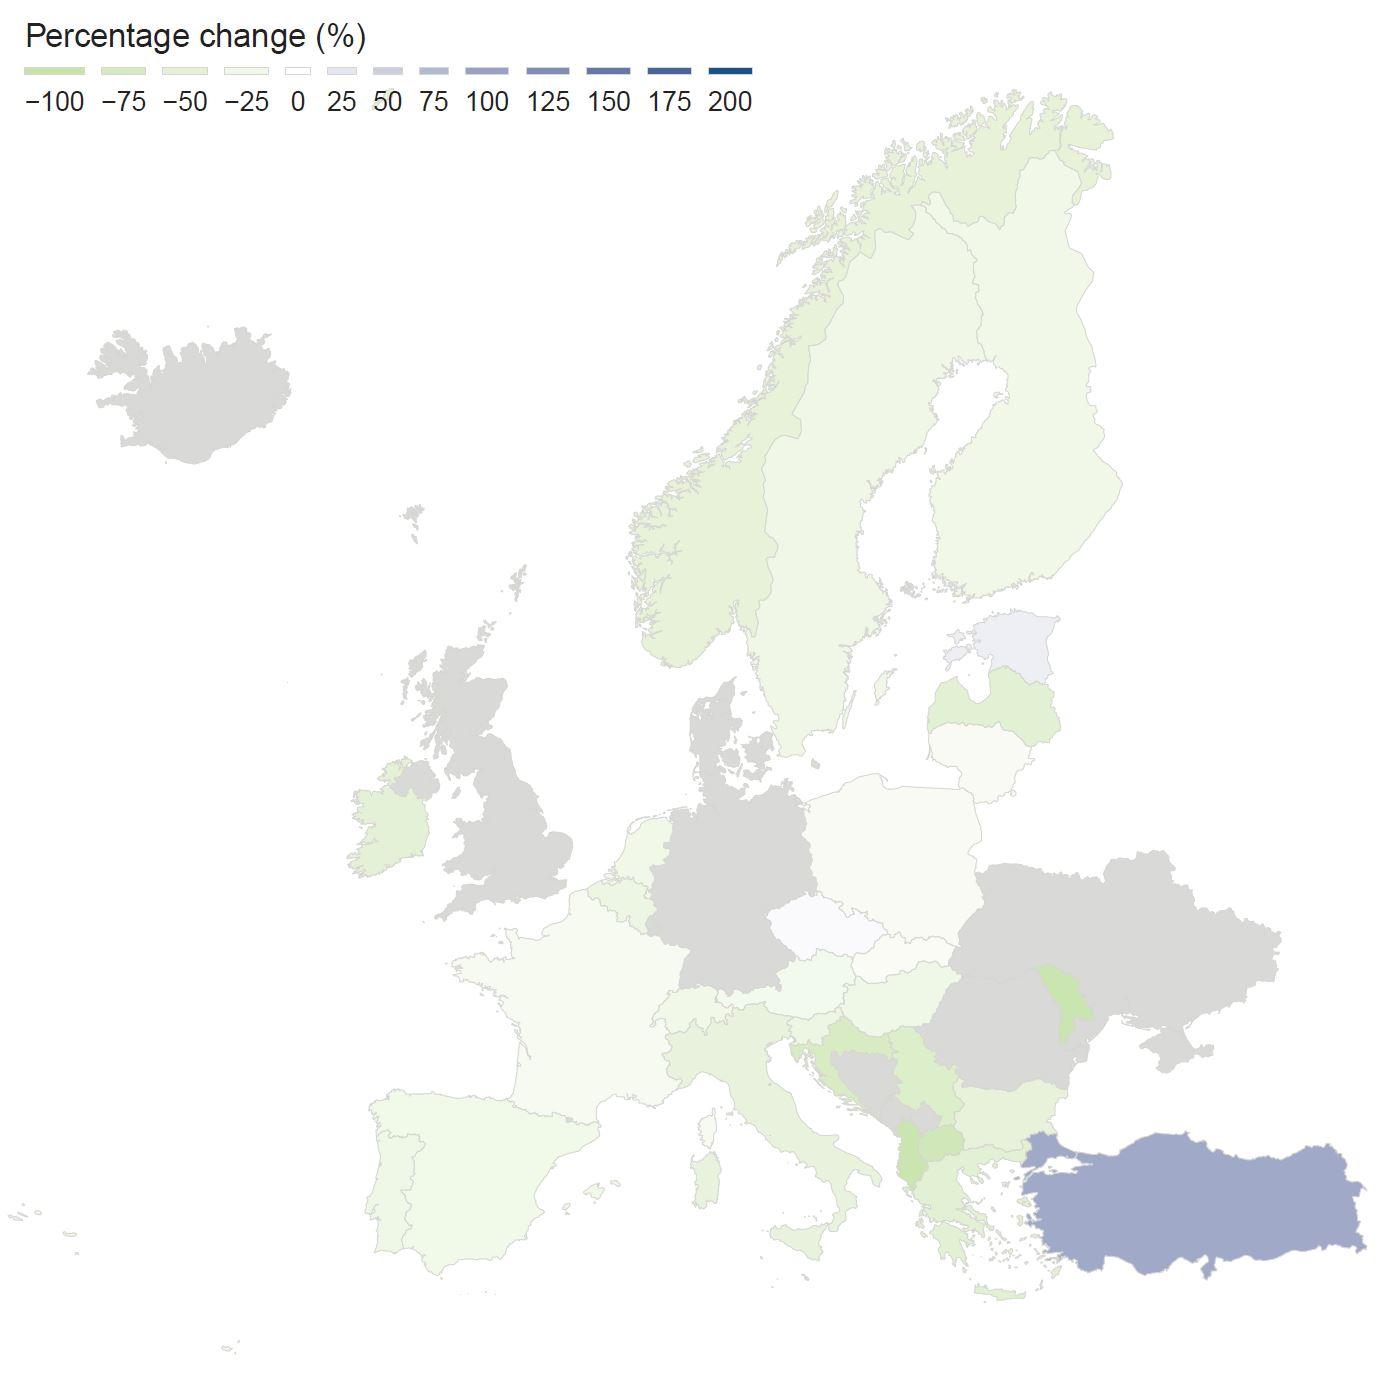
Figure 5c. Percentage change between 2019 (pre-pandemic) and 2021 (post-pandemic)
Box 1. Railway resilience in Türkiye
First, Türkiye's early response to the Covid-19 pandemic minimised the need for further restrictive measures and protected passenger flows. Despite a lack of certainty on how to deal with the virus, Türkiye's early preventative actions minimised the number of Covid-19 cases and meant the country avoided lockdowns in 2020. In 2021, Türkiye implemented its first and only lockdown for three weeks in April as case numbers were rising. This avoided travel restrictions between Türkiye and European neighbours. Türkiye's efforts to combat Covid-19 were praised by the World Health Organisation (WHO). A combination of quick responses and moderate mobility-restricting measures allowed the economy to continue growing and for passengers to keep travelling throughout the pandemic. Second, the Turkish economy has grown rapidly over the last decade and recorded positive growth rates even during the pandemic. From 2010 to 2021, the yearly average growth rate was 6%, far higher than for the rest of the OECD countries at 1.9%. Türkiye was one of the few high-middle-income countries that experienced positive economic growth in 2020. Among OECD countries, Türkiye had the second-largest economic growth (+1.9%) in 2020, just behind Ireland. For 2021, the country had an annual economic growth of 11.4%, positioning Türkiye in third place among OECD countries. Thanks to the resilience of the Turkish economy, passenger transport demand remained relatively high for road (-1%) and rail (-25%) in 2021 compared to 2019. Third, the absolute number of railway passengers increased constantly throughout the 2010s, boosted by numerous new rail corridors in the country. From 1970 to 2010, rail demand per year was around 5 700 million passenger-kilometres, presenting minimal year-on-year variations. Since 2011, the number of passenger-kilometres has increased constantly, attaining a historical maximum of 14 259 million passenger-kilometres in 2019. These gains reflect the opening of new high-speed rail corridors, including Ankara-Eskisehir (2009), Ankara-Konya (2011), Konya-Eskisehir (2013), Ankara-Istanbul (2014) and Konya-Istanbul (2014). The numbers will continue to increase thanks to other major corridors currently under construction, like Ankara-Izmir. Türkiye's investment in rail infrastructure was estimated at 0.2% of GDP in 2017 and reflects its willingness to achieve the 2053 Transportation and Logistics Master Plan. Together, these three factors helped maintain Türkiye's high rail use following the worst of the pandemic. Although rail use has increased, mode share has remained stable since 2010; the country still relies heavily on road transport. The increase in total passenger transport demand has been absorbed by both rail and road transport. Mitigating transport CO2 emissions requires combining rail infrastructure expansion with policy measures to incentivise rail transport. In this way, new passenger transport demand, driven by economic and population growth, could be attracted to greener transport modes, like rail. |
Road passenger transport proves more resilient than rail during pandemic
Until 2019, road transport by passenger car, buses and coaches increased in Europe and Türkiye, with the most significant increases in North Macedonia (+76%), Türkiye (+50%) and Iceland (+46%). The only two countries that showed a contraction of road transport between 2010 and 2019 are Sweden (-10%) and Spain (-4%). Changes between 2019 and 2021 show that most countries experienced a contraction smaller than 10% due to the Covid-19 pandemic, with Italy (-29%), Croatia (-13%) and France (-11%) the three most affected economies among the reporting countries. Compared to 2010, most countries have returned to the level at par or above par, except for Italy (-25%), Sweden (-16%), and Finland (-11%) (Figure 6).
Figure 6. Europe and Türkiye road passenger transport
(percentage changes of passenger-kilometres from 2010)
Figure 6a. Percentage change between 2010 and 2019 (pre-pandemic)

Figure 6b. Percentage change between 2010 and 2021 (post-pandemic)
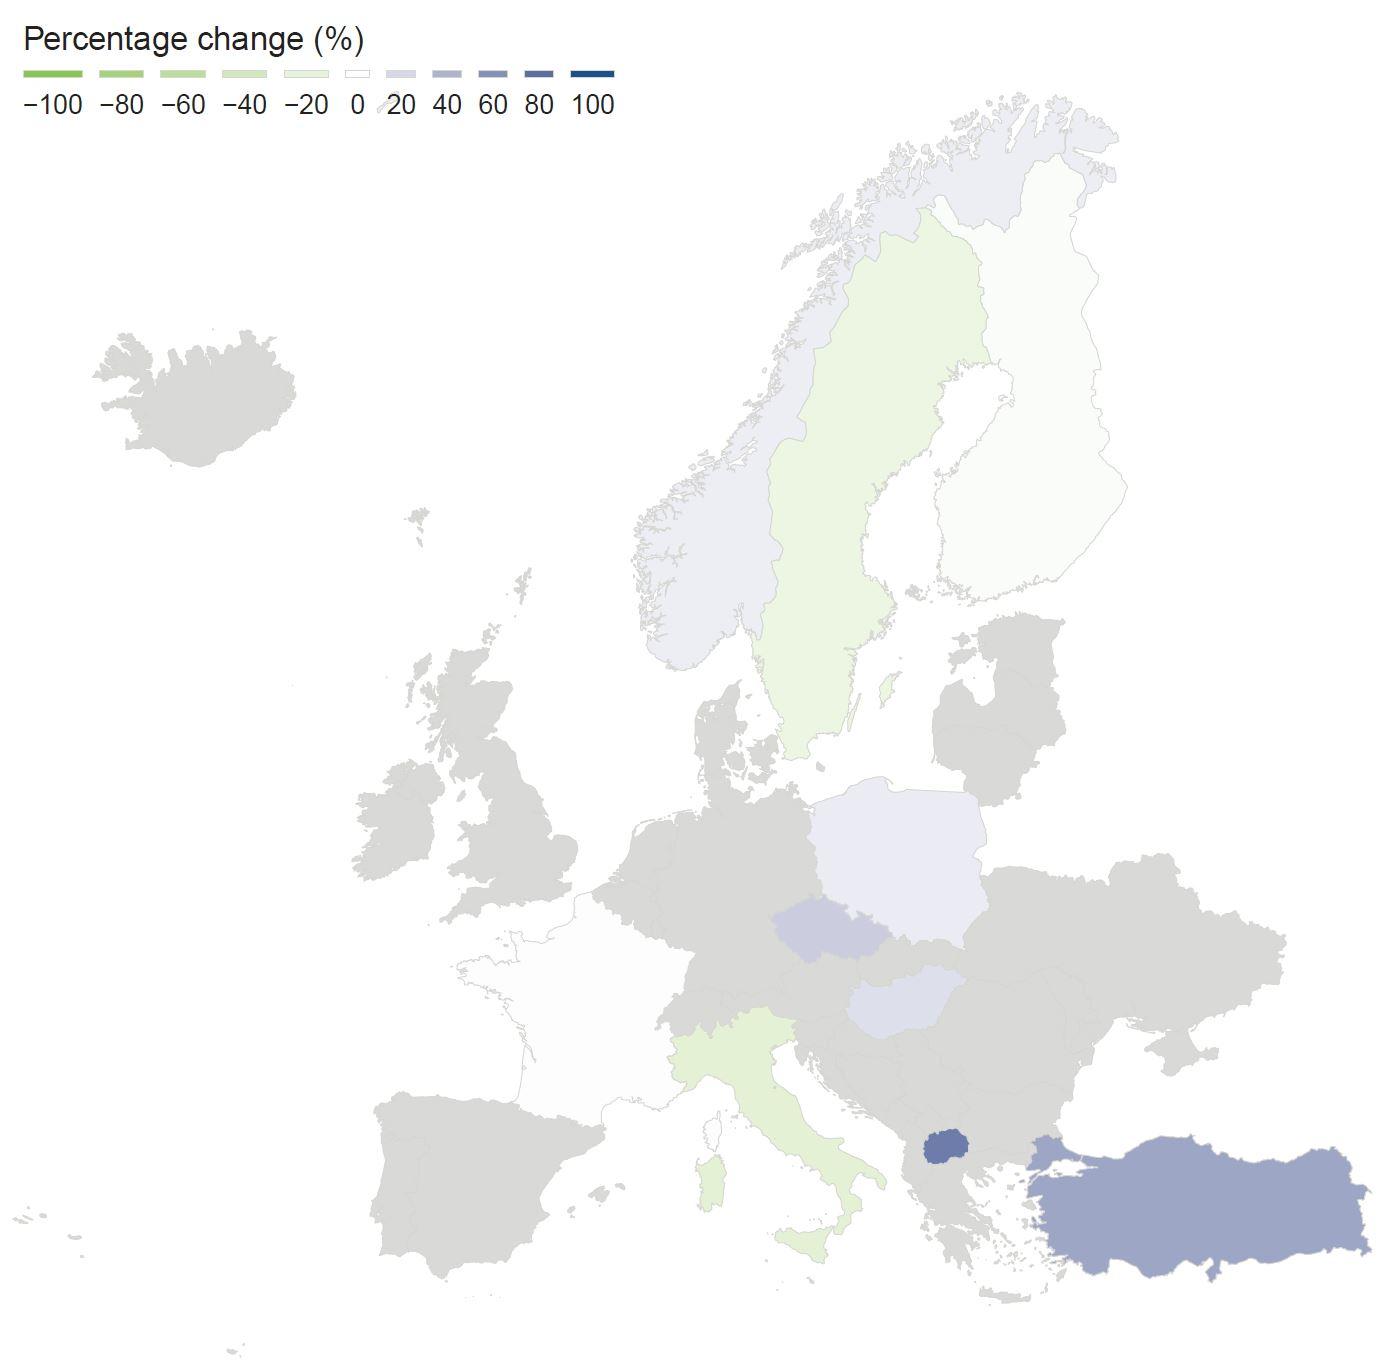
Figure 6c. Percentage change between 2019 (pre-pandemic) and 2021 (post-pandemic)
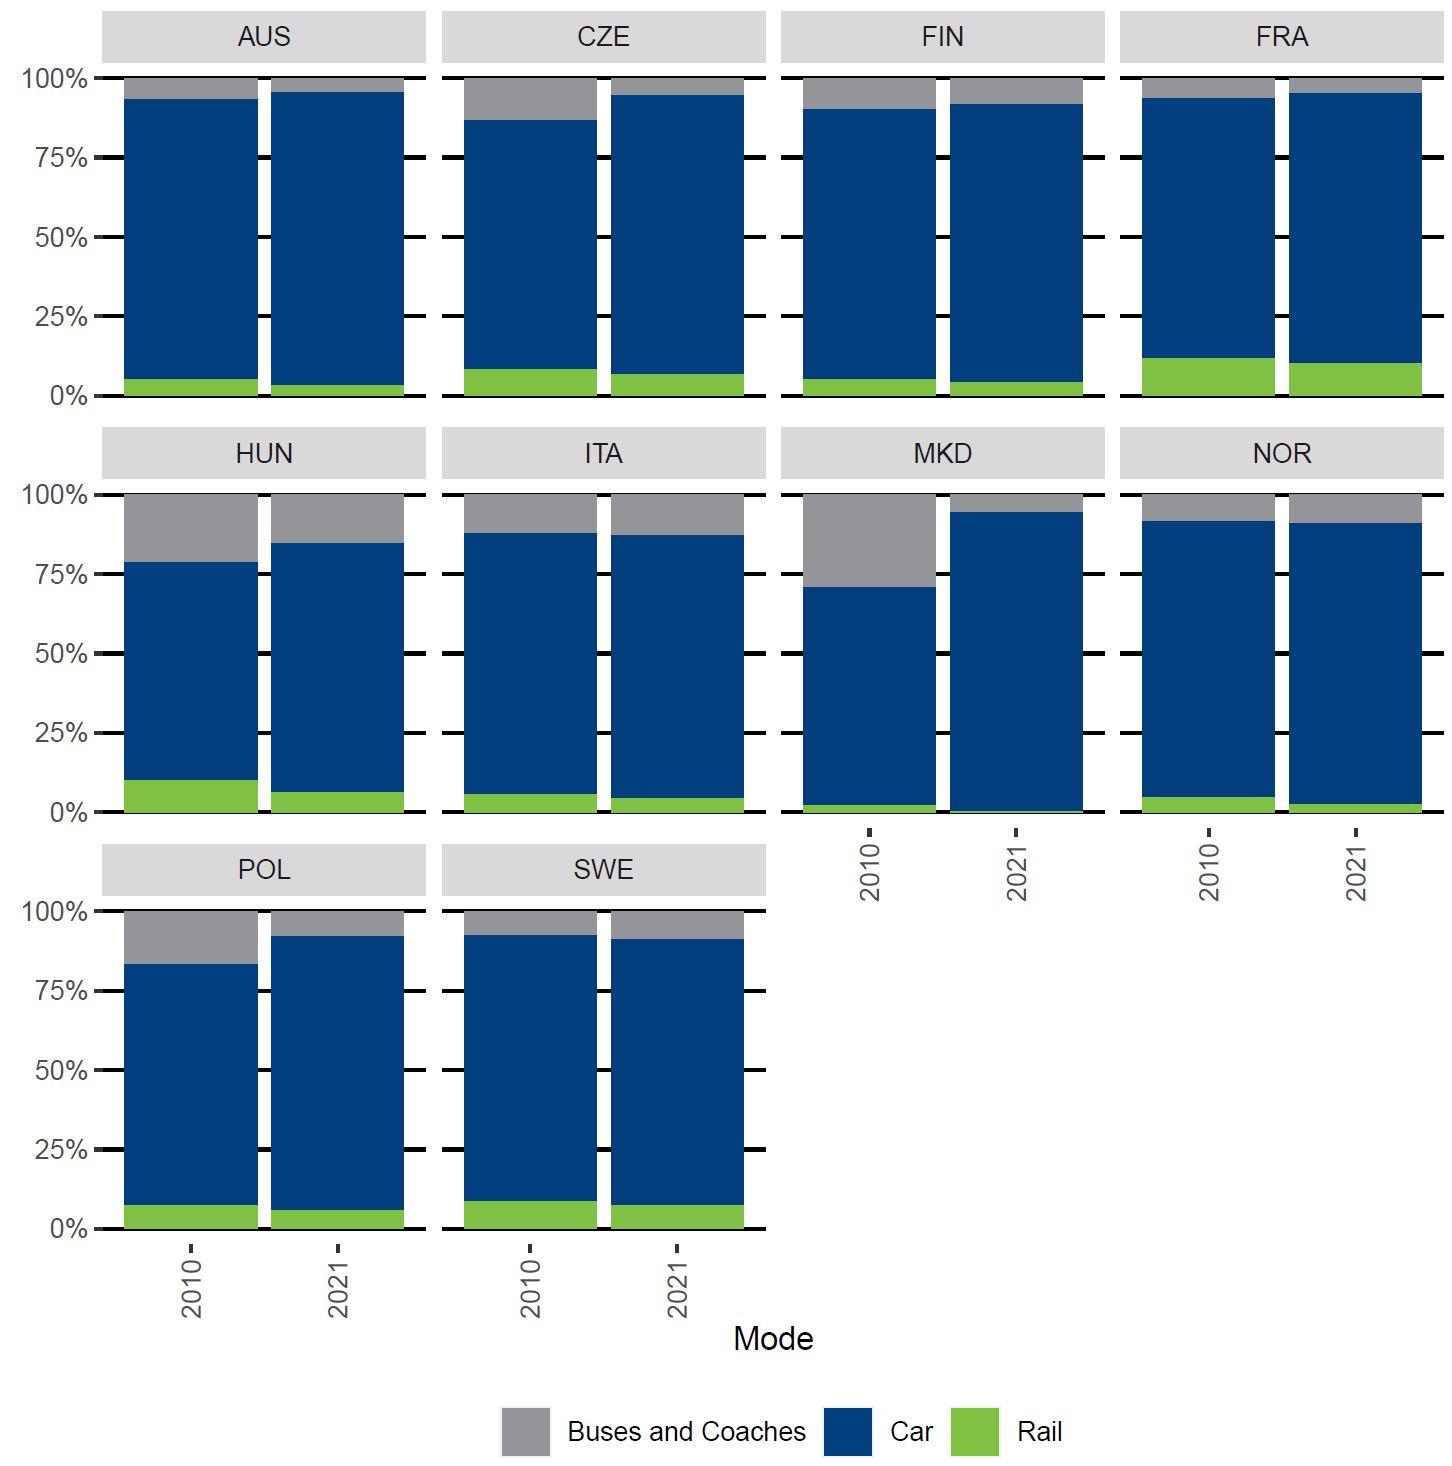
Increasing share of car use for all countries
The pandemic has a lesser impact on road passenger transport. Private vehicles can continue to provide mobility when social distancing requirements are in place. Buses, coaches and rail became less attractive due to social distancing measures. Therefore, these modes were heavily disrupted by restrictive pandemic measures. The countries that saw the most significant car share increases were North Macedonia (+26%), Poland (+10%) and Hungary (+10%). This modal shift towards private vehicles will increase CO2 emissions unless reversed (Figure 7).
Figure 7. Mode shares of passenger transport
(share of passenger-kilometres by mode)
About the statistics
The data presented in this Statistics Brief are from the ITF survey "Trends in the Transport Sector", which includes variables on freight transport, passenger transport and road safety. Road safety data include the number of road crashes, injured persons and fatalities (30 days). The data series starts in 1970 and continues until the current year-1, or the most recent year for which data is available. The survey is completed by ITF member countries, processed by ITF statisticians and published each year on 31 October.
Although there are clear definitions for all the terms used in this survey, individual countries may have different methodologies for calculating tonne-kilometres and passenger-kilometres. These methods could be based on transport or mobility surveys and may use very different sampling methods and estimating techniques, which can affect the comparability of the statistics. Additionally, while the definition of road fatalities is consistent across most countries, this is not the case for road injuries. Not only do countries have different definitions, but road injuries are underreported. However, data for individual countries are usually consistent over time and helpful in identifying underlying trends.
ITF recommends reading the metadata to check the data coverage for each country. Detailed data descriptions and notes on the methodologies are available at the following links:
For further information about this Statistics Brief, please contact Mr Diego Botero
| Date of Publication | 1 December 2022 |
|---|---|
| Document |
|
| Publication Type | Statistics Brief |
| Publisher | ITF |