Signs of recovery in global trade since August 2020
The latest update of global freight data collected by the International Transport Forum at the OECD for the period including June 2021 shows the following:
- The impact of the pandemic was evident between April and July 2020, reflected in dramatically lower air and sea freight volumes in the US and EU27.
- In May 2021 air freight volumes, considered as a lead indicator for overall economic performance, were 48% higher than in June 2008 in the EU27, while in June 2021 they were 12% higher in the US.
- Exports by air were the first to drop, falling between April and July 2020 in both the United States and the EU27. Airborne exports to BRICS and also to Asia still held up during the crisis.
- Surface freight volumes were not significantly impacted by the Covid 19 pandemic.
Subscribe to ITF Statistics Briefs
The Covid-19 pandemic had a major negative impact on air and sea trade between April and July 2020, according to preliminary seasonally adjusted data (Figure 1). Since August 2020, air and sea trade has started to recover.
Airfreight volumes (measured in tonnes of goods moved), a lead indicator for economic growth, followed two different paths in the EU27 and in the United States. Before the Covid 19 pandemic, in the EU27, air freight volumes were around 20% higher than in June 2008 and between April and June 2020, they decreased at a level that was around 8% higher than before the global financial crisis of 2008. In May 2021 air freight volumes recovered and were 48% higher than in June 2008. In the US, already before the pandemic air freight was stagnating at the same level as the crisis in 2008 and between May 2020 and July 2020 they were 1% lower than in June 2008. Since then, they recovered reaching in June 2021 a level that it was 12% higher than before the financial crisis. Both in the EU27 and in the US, exports by air suffered much more than imports.
In the EU, sea freight volumes had been stable and above the pre-2008 crisis levels from mid-2014 to March 2020. In the United States, they largely stagnated at below pre-2008 crisis levels, with 2018 as an exception. However, between April and June 2020, the volume of goods moved by sea fell 1% in the EU27 and 4%in the United States compared to June 2008. Since August 2020, sea freight volumes have recovered in the EU27 (+9% in May 2021 compared to June 2008), but not in the US, where the volumes remained around the pre-2008 crisis. Both in the EU27 and in the US, imports by sea suffered much more than exports.
Exports to BRICS countries and Asia have been the locomotive of European and North American growth since the crisis of 2008. In May 2021, exports by sea from the EU27 to BRICS were 91% above pre-2008 crisis peaks, to Asia they were 86% higher. US exports by sea to BRICS almost doubled. By contrast, air-borne exports to Asia from the EU27 and the US have slowed down as Covid-19 hit the world (Figures 2-5), but recovered quickly.
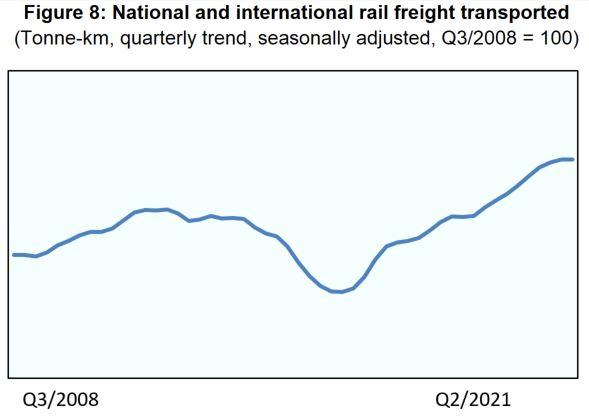
Data on the value of US trade with Mexico and Canada by rail and road did not show a significant impact of the Covid 19 pandemic. Similarly, EU27 trade with neighbouring countries was not too much impacted by Covid-19 (Figure 6). In ITF countries with available data, rail and road freight transport has a minor decrease in the second quarter of 2020, but since the third quarter of 2020, it has recovered (Figure 7). In China, rail freight transport was not impacted by the pandemic (Figure 8).
Figure 1: External trade, percentage change from June 2008
(Tonnes, monthly trend, seasonally adjusted)
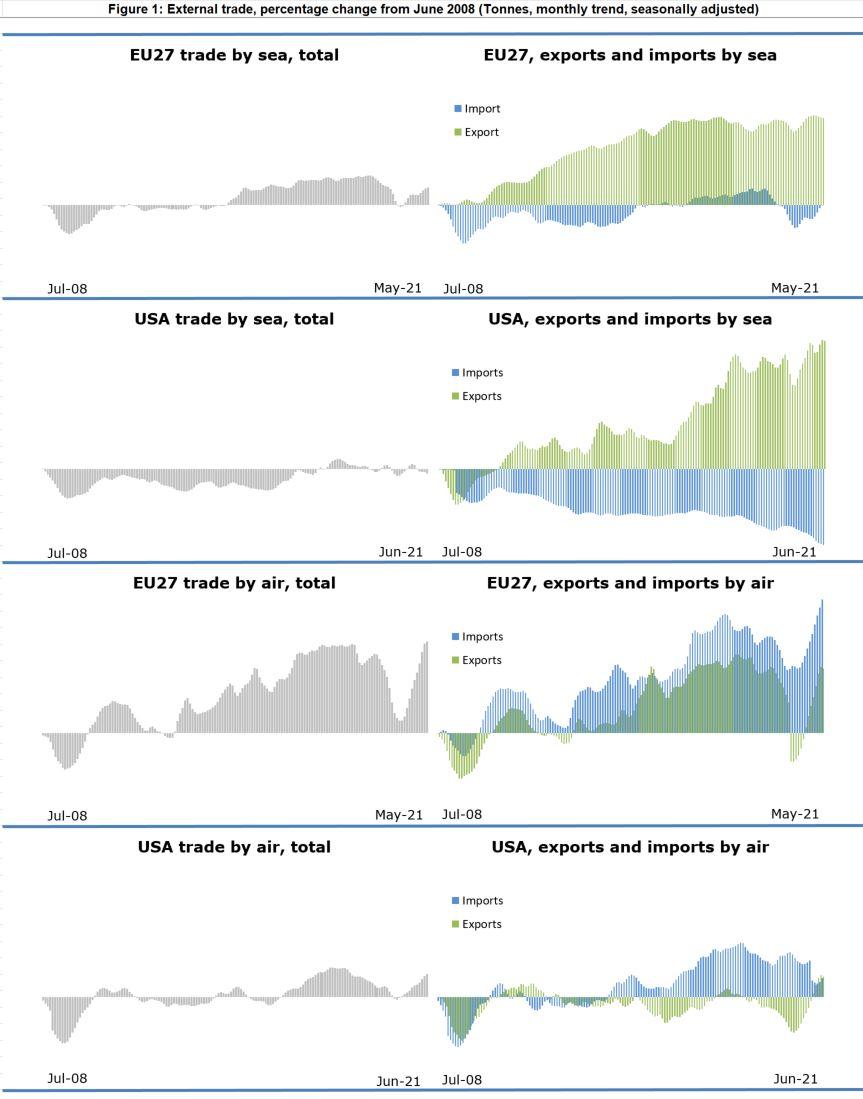
Figure 2: EU-27 external trade by sea, percentage change from June 2008
(Tonnes, monthly trend, seasonally adjusted)
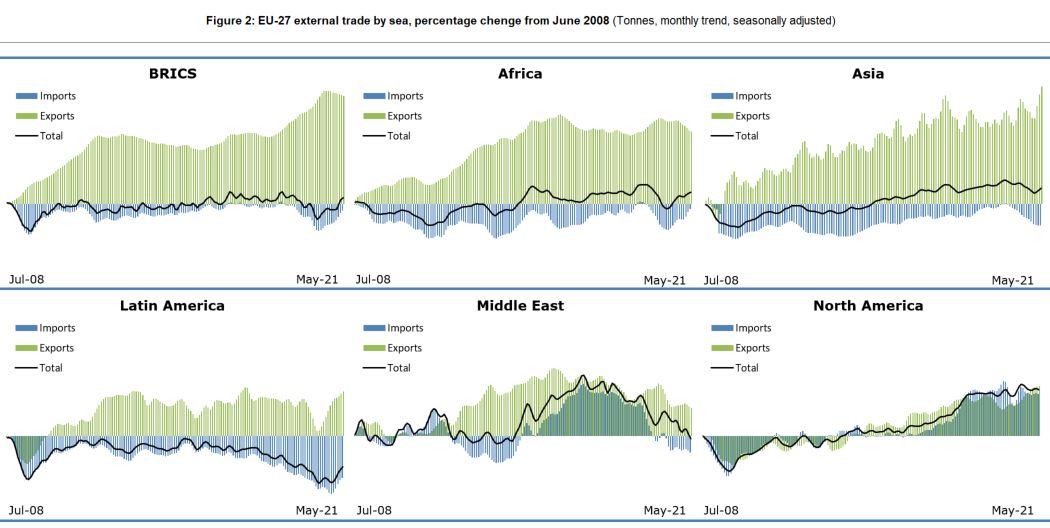
Figure 3: EU-27 external trade by air, percentage change from June 2008
(Tonnes, monthly trend, seasonally adjusted)
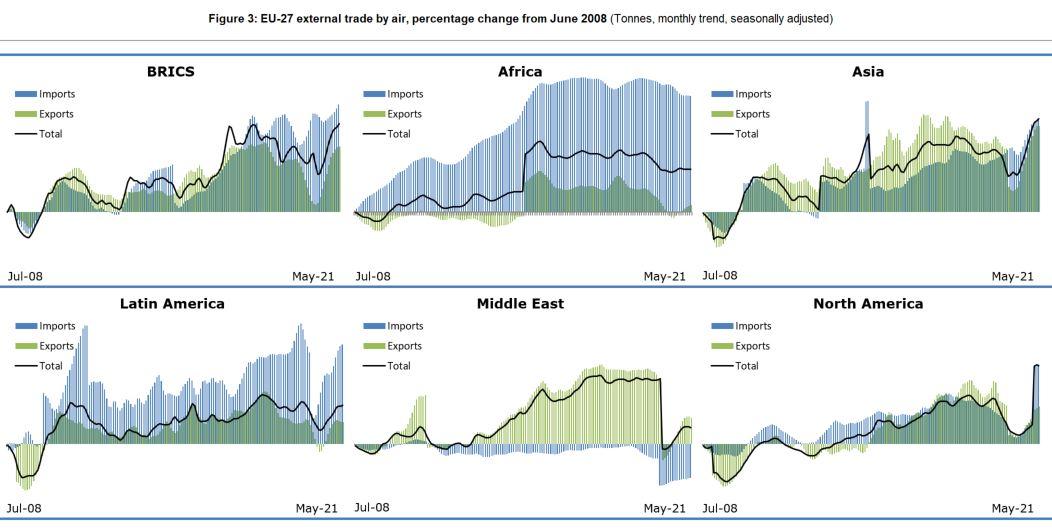
Figure 4: USA external trade by sea, percentage from June 2008
(Tonnes, monthly trend, seasonally adjusted)
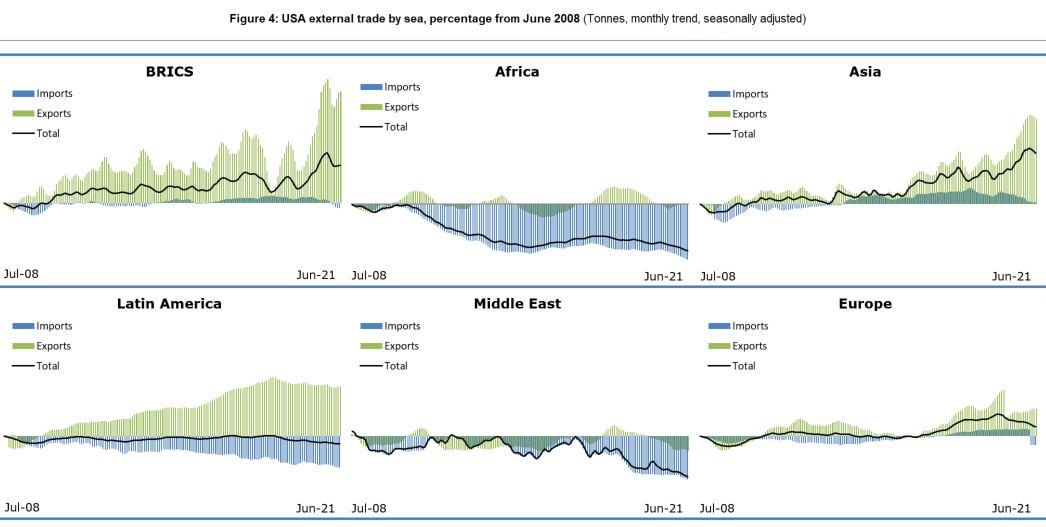
Figure 5: USA external trade by air, percentage change from June 2008
(Tonnes, monthly trend, seasonally adjusted)
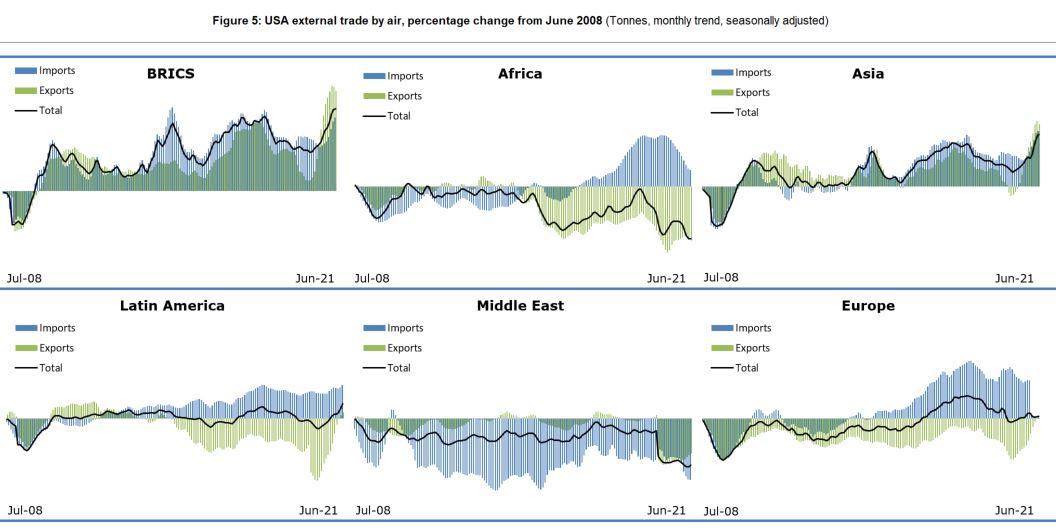
Figure 6: USA and EU27 external trade by rail and road, percentage change from June 2008
(Current value in USD/EUR, monthly trend, seasonally adjusted)
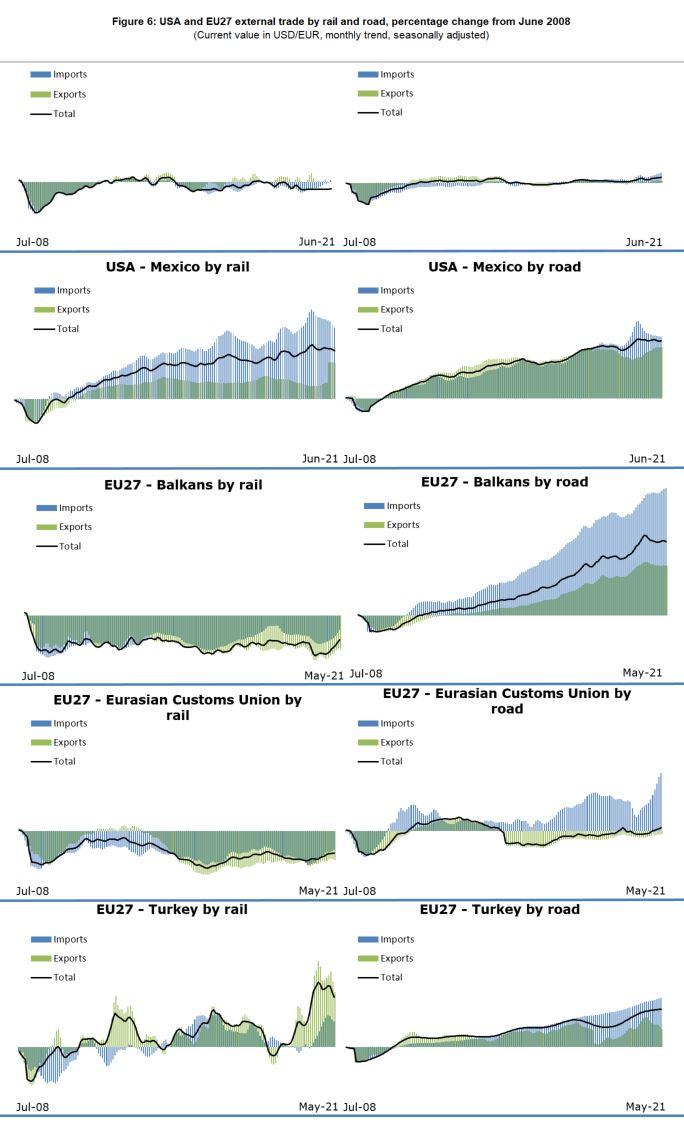
Figure 7: National and international rail and road freight transported
(Million tonne-km, trend seasonally adjusted, Q3/2008 = 100)
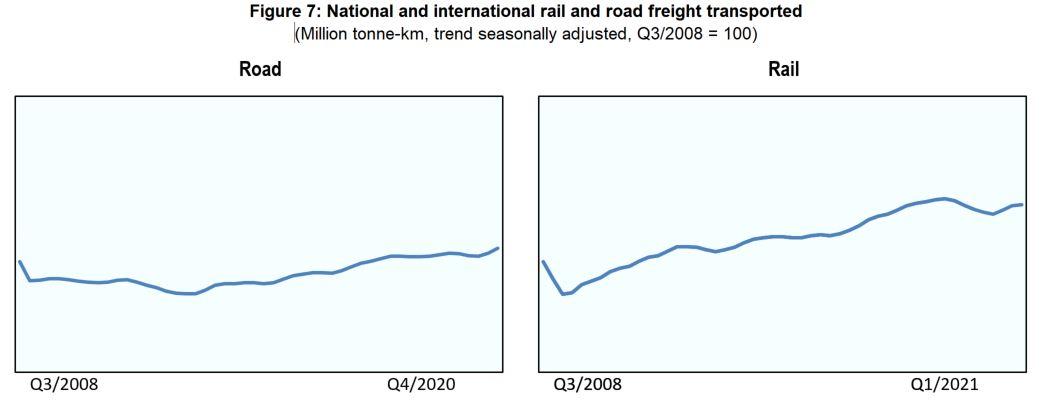
Figure 8: National and international rail freight transported
(Tonne-km, quarterly trend, seasonally adjusted, Q3/2008 = 100)
