Download the Statistics Brief as a visual PDF
Why is investment in transport infrastructure falling?
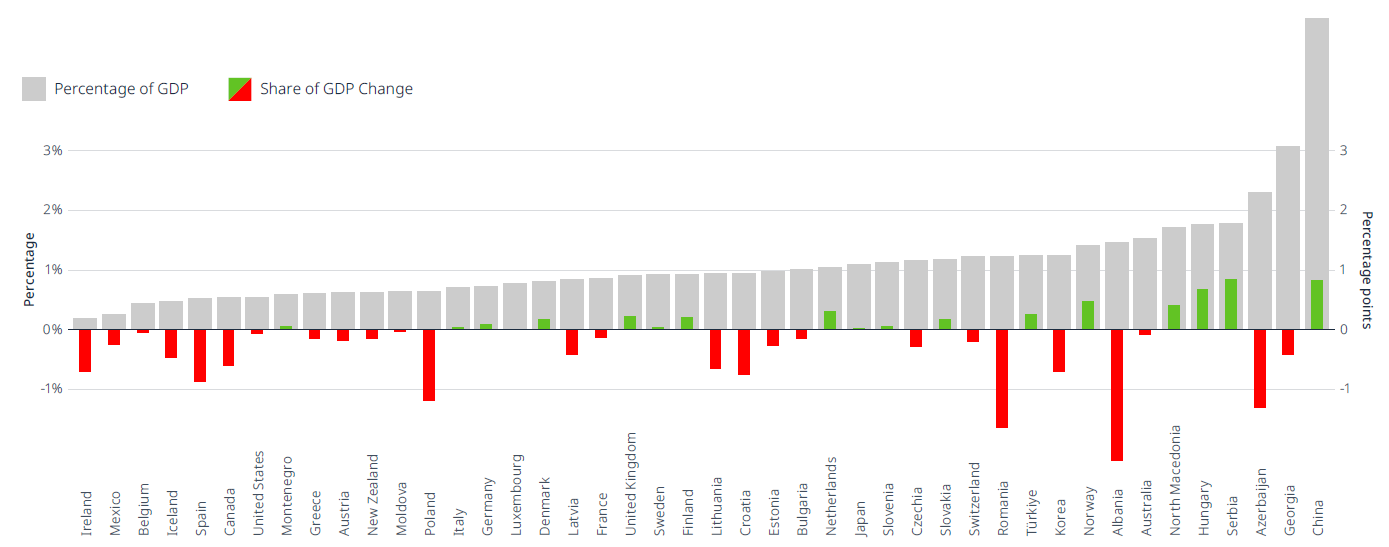
Over half of ITF reporting member countries show a reduction in total inland transport investment as a percentage of GDP. The ITF's moving average analysis explores the most recent data, comparing the average from 2018 to 2022 with the 2008-12 average to reveal two significant trends.
First, more developed countries are characterised by low transport infrastructure investment-to-GDP ratios and stagnant investment growth. These are the hallmarks of mature transport systems. Hungary and Norway are the developed countries with the highest transport infrastructure investment-to-GDP ratio (1.8% and 1.4%, respectively), and also experienced the highest increase in inland transport investment from 2008-12 to 2018-22.
Strategically located countries between Central Asia and Eastern Europe present a high investment-to-GDP ratio. The geographical positions of Azerbaijan, Bulgaria, Georgia and Serbia are a clear determinant of their high inland transport investment. Their locations are crucial for Eurasian connectivity, international trade corridors and infrastructure projects such as the New Silk Road Initiative.
See how transport infrastructure investment compares across countries and over time
Total inland transport investment as a percentage of GDP (2018-22 average) and percentage of GDP change (2008-12 compared to 2018-22 average)
Go to top
Spotlight: Bridging fjords and shifting to rail in Norway
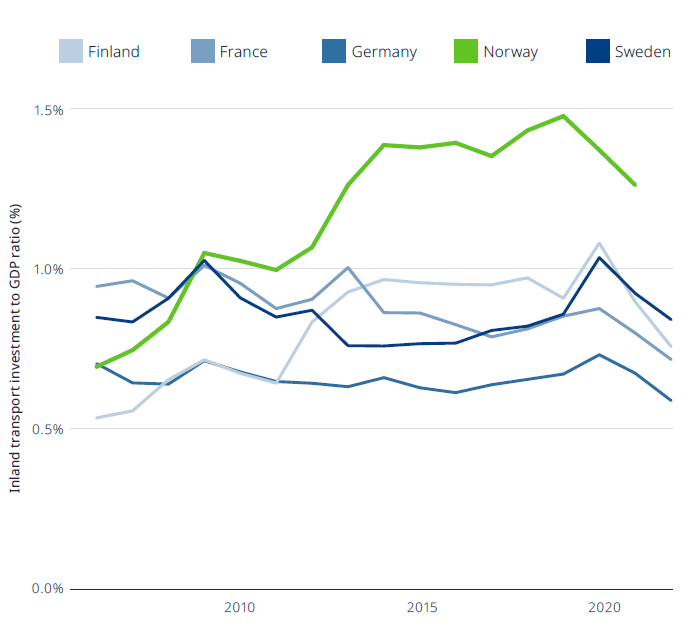
Norway’s challenging terrain demands innovative solutions to connect its counties. Until recently, the country’s main highways were interrupted by numerous fjords, islands and bays, forcing passengers to take ferry connections to travel along the E39 coastal highway. Aiming to improve road connectivity, in 2014, the Norwegian government set the goal of a ferry-free E39 to connect Western Norway. Approximately EUR 29 billion was dedicated to the transformation of this highway, connecting its separate segments via bridges and tunnels.
According to the National Transportation Plan for 2014-23, the government upgraded other crucial corridors, improving connectivity within the country and with its neighbours.
As for rail, Norway is making major efforts to improve its 4 000 km of outdated rail infrastructure by building new tracks, updating the existing network, investing in new digital signalling and strengthening cross-border railway connections.
Norway is now looking to shift from passenger and freight road transport towards rail transport. Improved online Internet coverage on trains and promoting rail transport for heavy commodities, such as lumber and ores, are part of the plan. The main development projects aim to connect Oslo with other urban areas in Eastern Norway. It is expected that the rail sector in Norway will keep growing. As part of its National Transportation Plan for 2022-33, the Norwegian government will allocate approximately EUR 34 billion over the next 10 years.
Upcoming major projects, including the InterCity network, will change the way Norwegians move around the country. The InterCity Network will add 270 km of double tracks, allowing speeds up to 250 km/h. It is expected to be completed by 2036 at an estimated cost of approximately EUR 12 billion.
Extreme terrain and connectivity policies show in Norway’s investment lead
Total inland transport investment as a percentage of GDP
Geography plays a crucial role in seaport investments
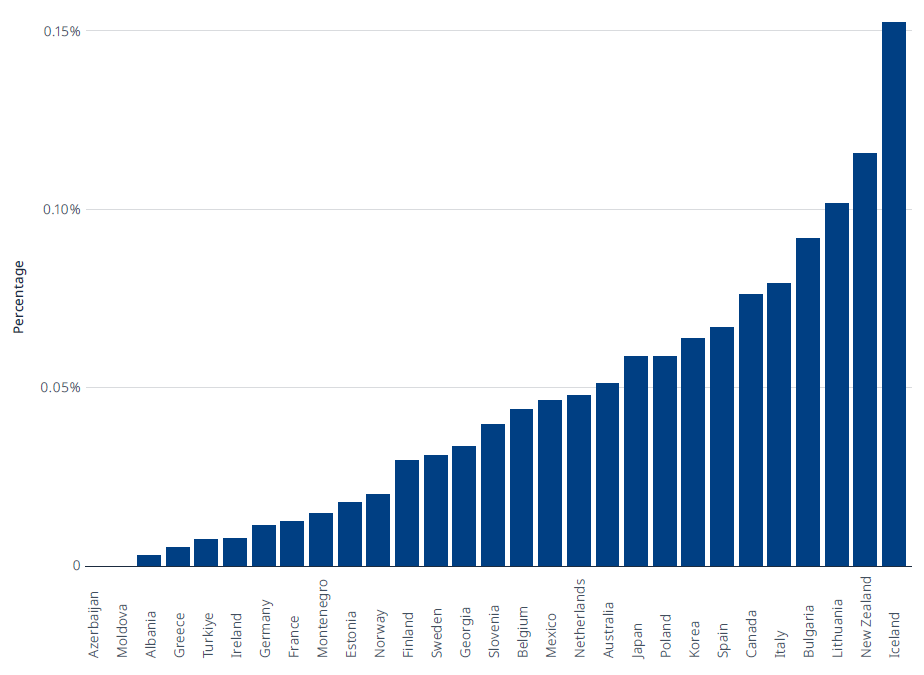
For the first time, this ITF Statistics Brief explores the investment-to-GDP ratio for ports. Iceland posts the highest port investment-to-GDP ratio at 0.15%, outperforming other islands, peninsulas or countries with longer coastlines.
Island nations – such as Iceland, Japan and New Zealand – invest a high percentage of their GDP in seaport infrastructure due to their critical dependence on maritime transport.
On average, Japan invested EUR 2.5 billion annually in port infrastructure between 2018 and 2022, the highest absolute amount among reporting countries. This can be explained by Japan’s geography, which makes it highly dependent on sea trade. Japan is also vulnerable to coastal natural disasters, which demand constant high investments in this sector. Following Japan, Italy, a peninsular country, and Canada, the country with the largest coastline, invested EUR 1.3 billion and EUR 1.1 billion, respectively.
While in absolute value Japan invests an outstanding amount of capital in its port infrastructure, it falls short relative to GDP compared to other countries. Lithuania and Bulgaria, non-island countries with relatively small coastlines, invest, respectively, 0.10% and 0.09% of their GDP in port infrastructure.
Seaport investment by country
Seaport investment as a percentage of GDP (average 2018-22)
Go to top
Tourism and connectivity drive airport investment
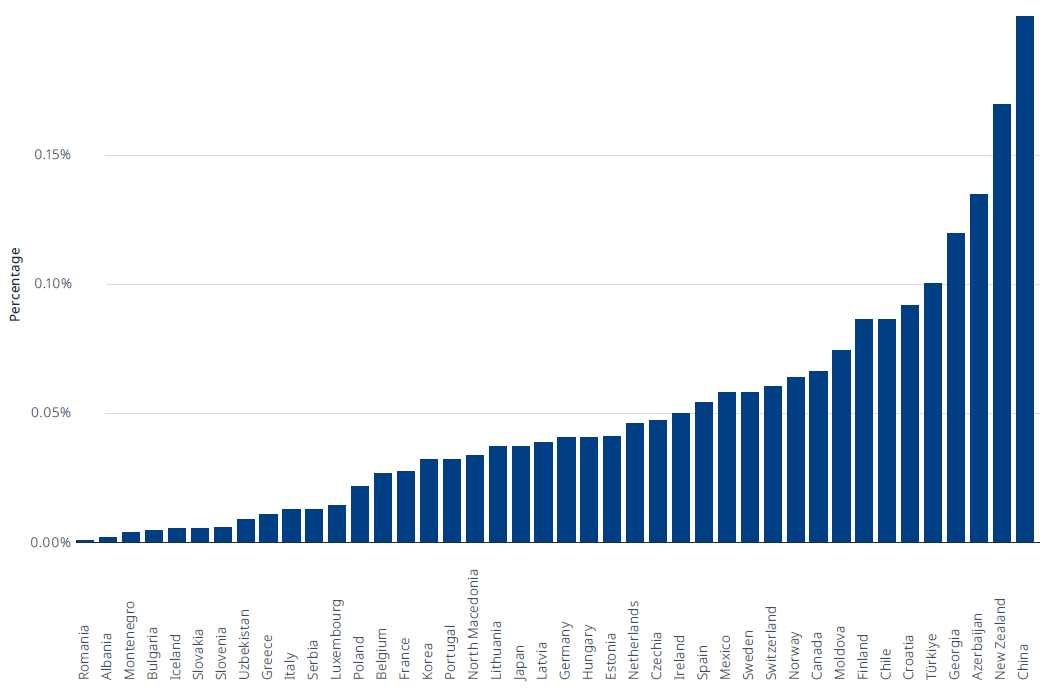
In our first-ever data analysis on airport investment levels, China leads the ranking of airport investment-to-GDP ratio, spending 0.2% of its GDP on airports. New Zealand is second, at 0.17%.
Azerbaijan (0.13%), Georgia (0.12%) and Türkiye (0.10%) complete the top five. These countries provide a bridge between Europe and Asia. Türkiye’s outstanding absolute airport infrastructure investment (EUR 900 million), and its national carriers, position the country as an international aviation hub.
In absolute values, the countries that lead the ranking of highest annual average investment in airports between 2018 and 2022 are China (EUR 2.7 billion), Japan (EUR 1.5 billion), and Germany (EUR 1.3 billion). This is explained by the size of their economy.
China leads global airport investment
Airport investment as a percentage of GDP (average 2018-22)
Highlight: New Zealand and Türkiye
New Zealand’s tourism sector has witnessed a recent boom, evidenced by increasing passenger numbers and international airlines. According to OECD data, inbound international passengers increased 36% between 2014 and 2019, before the Covid-19 pandemic.
To address the growing demand for tourism in New Zealand, Auckland Airport announced a four-year investment plan starting in 2018. In total, the airport will receive EUR 1 billion to increase international and domestic capacity and to provide a better and more efficient service for travellers.
Türkiye also recorded an increasing airport investment-toGDP ratio during the last decade. The country’s strategic location, at the intersection of Africa, Asia and Europe, has encouraged it to invest heavily in airport infrastructure. Istanbul Airport, the country’s biggest, was inaugurated in 2018 and already has the largest passenger capacity among European airports at 90 million passengers annually. By 2028, it aims to become the busiest airport in the world, raising its capacity to 200 million passengers.
The Istanbul Airport mega project, the importance of Türkiye’s national carriers worldwide, and the country’s central position have made Türkiye a major aviation hub.
The shift to cleaner transport is underway in most ITF countries
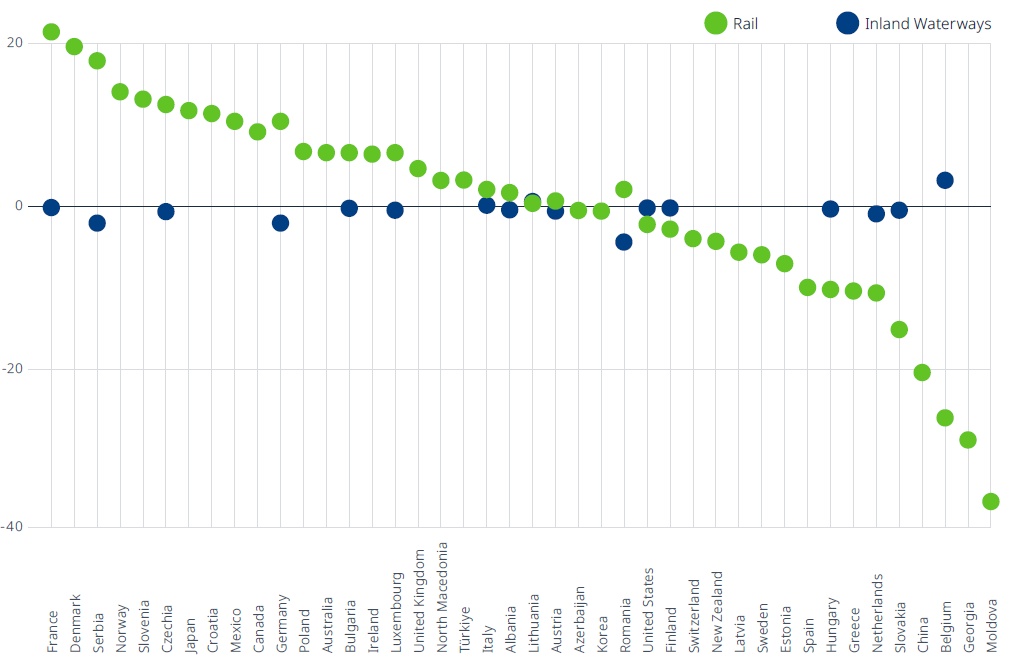
France and Denmark lead the shift in transport investment favouring cleaner modes based on a decade-long comparison of rail and inland waterway investment between 2008-12 and 2018-22. Since the latest ITF update, these two European countries confirm their lead in the investment transition towards lowercarbon mobility. France increased its rail investment share by 21.7 percentage points, while Denmark’s share increased by 20 percentage points. Moldova and Georgia continue to show the greatest shift away from rail transport, respectively, at -35.7 and -28.5 percentage points.
Inland waterway investment’s share of total inland transport investment is generally stable, with Belgium posting the largest growth (3.5 percentage points). Belgium is also the European country with the biggest shift towards road transport, increasing road infrastructure investment participation in total inland transport investment by 22 percentage points. The nation at Europe’s heart already has a dense rail network that requires limited levels of new investment.
Compare the investment switch towards a cleaner transport future across the globe
Rail and inland waterways investment participation change (percentage point difference between 2008-12 and 2018-22)
Go to top
Spotlight: Mexico’s “Railvolution”
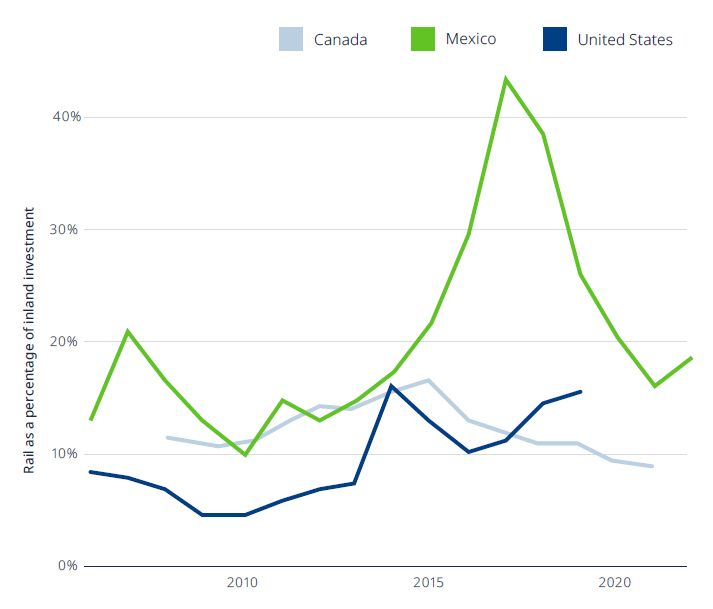
Mexico is outpacing its North American neighbours Canada and the United States, expanding its rail transport capacity in a region dominated by road transport.
Latin America has among the lowest use of railway transport worldwide. The network is old, underdeveloped, and ununified regionally. The unquestioned dominance of road transport in past decades has left rail infrastructure unused across countries in the region.
But things are changing: green transport and connectivity policies are favouring railway revitalisation.
The latest update of the ITF’s transport infrastructure investment data shows Mexico increasing in rail investment compared to other modes. From 2012 to 2022, Mexico annually directed, on average, 23% of its total inland transport investment towards rail infrastructure, approximately 11 percentage points higher than Canada and the United States.
While most of Mexico’s railway network is destined for freight transport only, recent governments have been working to expand rail provision for passengers. Mexico’s Secretariat of Infrastructure, Communications and Transport has financed projects including the México-Toluca (El Insurgente) line, the suburban train Ramal Lechería-AIFA, and lines 3 and 4 of the Guadalajara light train: all passenger trains aiming to increase regional and urban connectivity.
Other Mexican national Secretariats are also financing major projects such as El Tren Maya, the country’s longest passenger railway. The first segment was inaugurated in December 2023 and will be finalised by 2024, changing mobility in the Yucatan peninsula for locals and tourists alike.
Almost one-quarter of Mexico’s total inland transport investment goes to rail
Railway investment as a percentage of total inland transport infrastructure investment in North America
About the statistics
The ITF statistics on investment, maintenance expenditure and capital value of transport infrastructure for 1995-2022 are based on a survey sent to current ITF member countries. The survey covers total gross investment (defined as new construction, extensions, reconstruction, renewal and major repair) in road, rail, inland waterways, maritime ports and airports, including all sources of financing. It also covers maintenance expenditures financed by public administrations and the capital value of transport infrastructure. Inland infrastructure investment covers rail, road and inland waterways transport modes.
The ITF Secretariat collects data from member countries in national currencies, which are then converted to current prices and constant euros. Significant efforts have been devoted to collecting relevant deflators needed to calculate the constant Euro equivalent of data provided, since no purchasing power parity corrected general index exists for transport infrastructure investment.
Where available, a cost index for construction on land and water is used. Where these indices are not available, a manufacturing cost index or a GDP deflator is used.
Detailed country data for inland modes, maritime ports and airports, more detailed data descriptions and notes on the methodologies are available on the
OECD Data Explorer website.
The data in this Statistics Brief are as of 15 June 2024. Online datasets can be updated following countries’ revisions.
Disclaimer
The opinions expressed and arguments employed herein do not necessarily reflect the official views of the member countries of the ITF. This document, as well as any data and map included herein, are without prejudice to the status of or sovereignty over any territory, to the delimitation of international frontiers and boundaries, and to the name of any territory, city or area.
Date of publication: 25 June 2024


