Trade recovery in 2021 impeded by Omicron virus and Ukraine war
The latest global trade and freight data for February 2020 to May 2022 collected by the International Transport Forum show the following:
- Sea and air freight volumes fully recovered to pre-pandemic levels by Q3 2021.
- Some gains in trade volumes accumulated until September 2021 were lost toward the year’s end.
- The value-to-weight ratio of imports and exports by air increased sharply, reflecting the pandemic’s impact on trade costs.
- Starting in March 2021, the value-to-weight ratio for sea trade also rose as a result of surging maritime transport costs.
- Trade flows from the EU27 to BRICS and Asia significantly decreased since the beginning of the war in Ukraine in February 2022.
- US trade with these regions was less affected and remained above pre-pandemic levels.
- Trade via road and rail continued to grow between the EU27 and neighbouring countries as well as between the US and its neighbours.
- Eurasian trade flows relying on surface transport have declined since the beginning of the war in Ukraine.
Subscribe to ITF Statistics Briefs
Trade volumes began to recover in August 2020, and growth accelerated during Q1-Q3 2021. The resurgence of the Covid-19 pandemic due to the Omicron variant at the end of 2021 and the war in Ukraine at the beginning of 2022 reversed the positive trend in international trade in 2021. Both factors impacted the EU27 significantly more than the United States.
In September 2021, sea freight volumes fully recovered to the pre-pandemic level of February 2020 in the EU27 and the US. Exports by sea (measured in tonnes) from the US rose significantly during Q4 2021 and in the first five months of 2022. As a result, trade volumes were 10% higher in May 2022 than pre-pandemic levels. US imports by sea, however, stagnated during the first months of 2022 and, by May 2022, remained at pre-pandemic levels. Conversely, exports by sea from the EU27 began to drop from May 2021 while imports increased. In May 2022, EU27 exports by sea were 5% lower and imports 7% higher than in February 2020, the start of the Covid-19 pandemic (Figure 1).
Air freight recovered strongly in 2021 but started contracting again in early 2022. Air-borne imports to the US (measured in tonnes) grew by 12% in Q3 2021 and 23% in Q4 2021 compared to the pre-pandemic level, after having steadily declined during the previous five quarters. US exports by air grew throughout 2021 and early 2022, reaching all-time high export volumes in February 2022, 36% above the same month in 2020. In May 2022, imports were nevertheless still 21% above the pre-pandemic level, and exports 31%. EU27 trade by air also recovered well at the beginning of 2021; in June 2021, exports rose by 13% compared to February 2020 and imports by 27%. However, the momentum did not last, and overall air trade began to contract again during Q4 2021 to nearly pre-pandemic levels. In May 2022, EU27 imports were only 2% above those in February 2020, showing a poor performance compared to 2021. The fall in exports was not as sharp as for imports but still noticeable, reaching levels 6% higher compared to pre-pandemic levels (Figure 1).
The Covid-19 pandemic affected trade volumes as well as the types and value of freight. For instance, the value-to-weight ratio of air-borne trade (measured in local currency per tonne) increased sharply for EU27 exports as a result of the global sanitary crisis. From February to April 2020, the ratio for all exports increased by 38%, an all-time high. The variations in value-to-weight ratios for international freight over the past two years reflect the rise in production and transport costs due to the restrictions imposed on commercial flights and port operations, and the quarantine measures implemented by many countries (Figure 2).
The resurgence of Covid-19 due to the Omicron variant and the war in Ukraine devastated EU27 sea-borne trade with BRICS and Asian countries after a significant recovery. EU27 trade by sea with BRICS, African, Asian, and North American countries initially recovered during 2021, on average reaching pre-pandemic levels. However, from Q4 2021 until May 2022, sea exports to BRICS and Asian countries significantly contracted again. EU27 exports to BRICS countries in May 2022 were 19% lower than before the pandemic; those to Asia were 16% lower. Imports to the EU27 from both regions did not change much during this period. Trade volumes with North America and Africa picked up between Q4 2021 and May 2022, while sea-borne trade with the Middle East and Latin America remained at lower levels than before the Covid-19 pandemic (Figure 3).
Trade by air for the EU27 shows similar patterns to sea-borne trade as a result of the Omicron variant and the war in Ukraine. For air-borne trade with BRICS and Asian countries, the beginning of the war in Ukraine in February 2022 explained the drastic contraction of freight flows in both directions. Imports from BRICS and Asia were badly hit: in May 2022, they were 25% (BRICS) and 12% (Asia) below their February 2020 levels. Exports held up better: air-borne freight from EU27 to Asia was 6% below its pre-pandemic level, while BRICS trade by air was on par. Air-based trade between the EU27 and the Americas increased above the pre-pandemic level during the first months of 2022, whereas it has not entirely recovered with Africa and the Middle East since the beginning of the Covid-19 pandemic (Figure 4).
US trade with its partners rebounded despite international turmoil. US sea freight volumes were almost back to pre-pandemic levels for most of the US trade partners by May 2022. Maritime flows between the US and BRICS and Asian countries drove the overall growth of sea-based trade in Q1 and Q2 2021. Ever since, the US sea trade with these two regions has decreased. By May 2022, it had dropped from 22% above pre-pandemic levels in Q2 2021 to only 11% above for trade with BRICS, and from 22% to 12% higher with Asian countries. Moreover, trade by sea between the US and traditional trade partners in Latin America and Europe stagnated around pre-pandemic levels since 2020. Sea-based freight transport with the Middle East remained 2% below pre-pandemic levels in May 2022 and was 8% lower with Africa than in February 2020. US external trade by air in May 2022 was higher than in February 2020 with all but one region: only trade by air with the Middle East remained at par with pre-pandemic levels. That said, US trade by air with BRICS and Asian countries began to contract with the start of the war in Ukraine (Figure 5 and Figure 6).
Trade by road and rail was at its highest between EU27 and its neighbours and the US and its two neighbouring countries since the beginning of the Covid-19 pandemic. On average, surface trade (measured in local currency) accounted for only 21% of EU27 international trade and an almost negligible share for the US (less than 1%). Unlike sea and air freight, surface mode freight transport showed continuing growth in the US with its two neighbouring countries. In Europe, land-based freight flows with Balkan countries and Türkiye continued to grow from the beginning of 2021, despite the Omicron wave and the war in Ukraine. That was not the case for trade with Asia, however. From the start of the war in Ukraine, activity along the Eurasian rail and road corridors declined. Road freight was particularly affected, with exports via Eurasian road routes 34% lower in May 2022 than before the pandemic. Imports arriving in the EU27 by truck also sharply declined again, after a remarkable recovery during 2021. In May 2022, inbound road freight volumes were only 13% higher than in February 2020, after a high point in Q4 2021, when imports by road were 59% above pre-pandemic levels (Figure 7).
Figure 1.EU27 and US External trade, percentage change from February 2020
(Tonnes, monthly trend, seasonally adjusted)
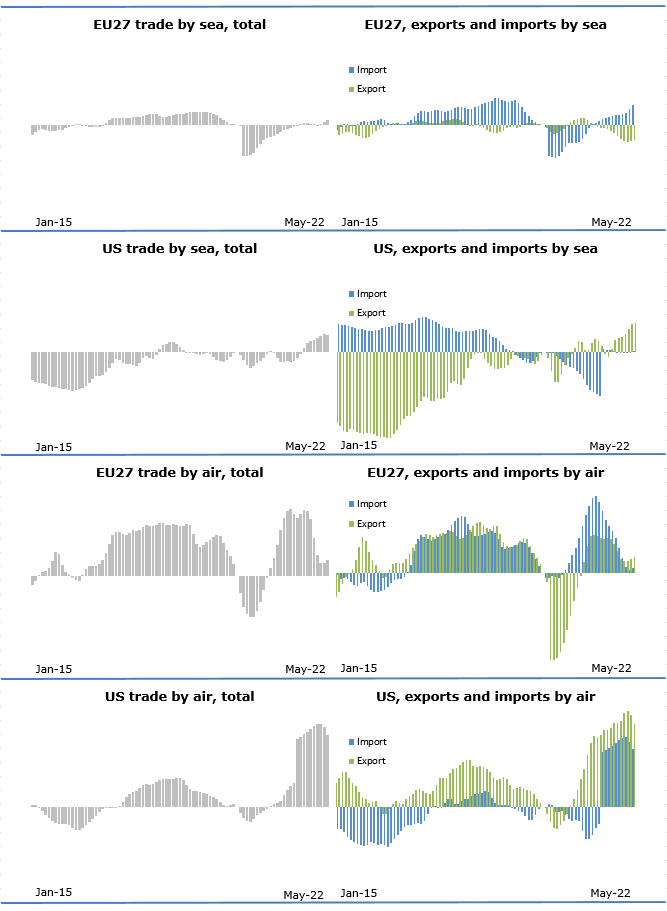
Figure 2.EU27 and US External trade, percentage change from February 2020
(Value of goods per tonne, monthly trend, seasonally adjusted)
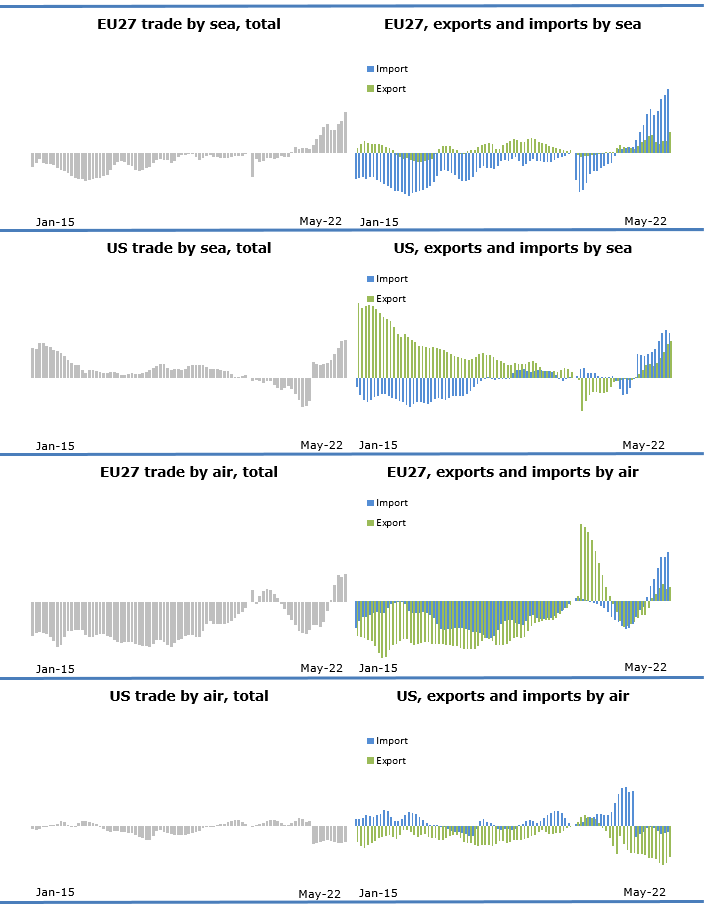
Figure 3. EU27 external trade by sea, percentage change from February 2020
(Tonnes, monthly trend, seasonally adjusted)
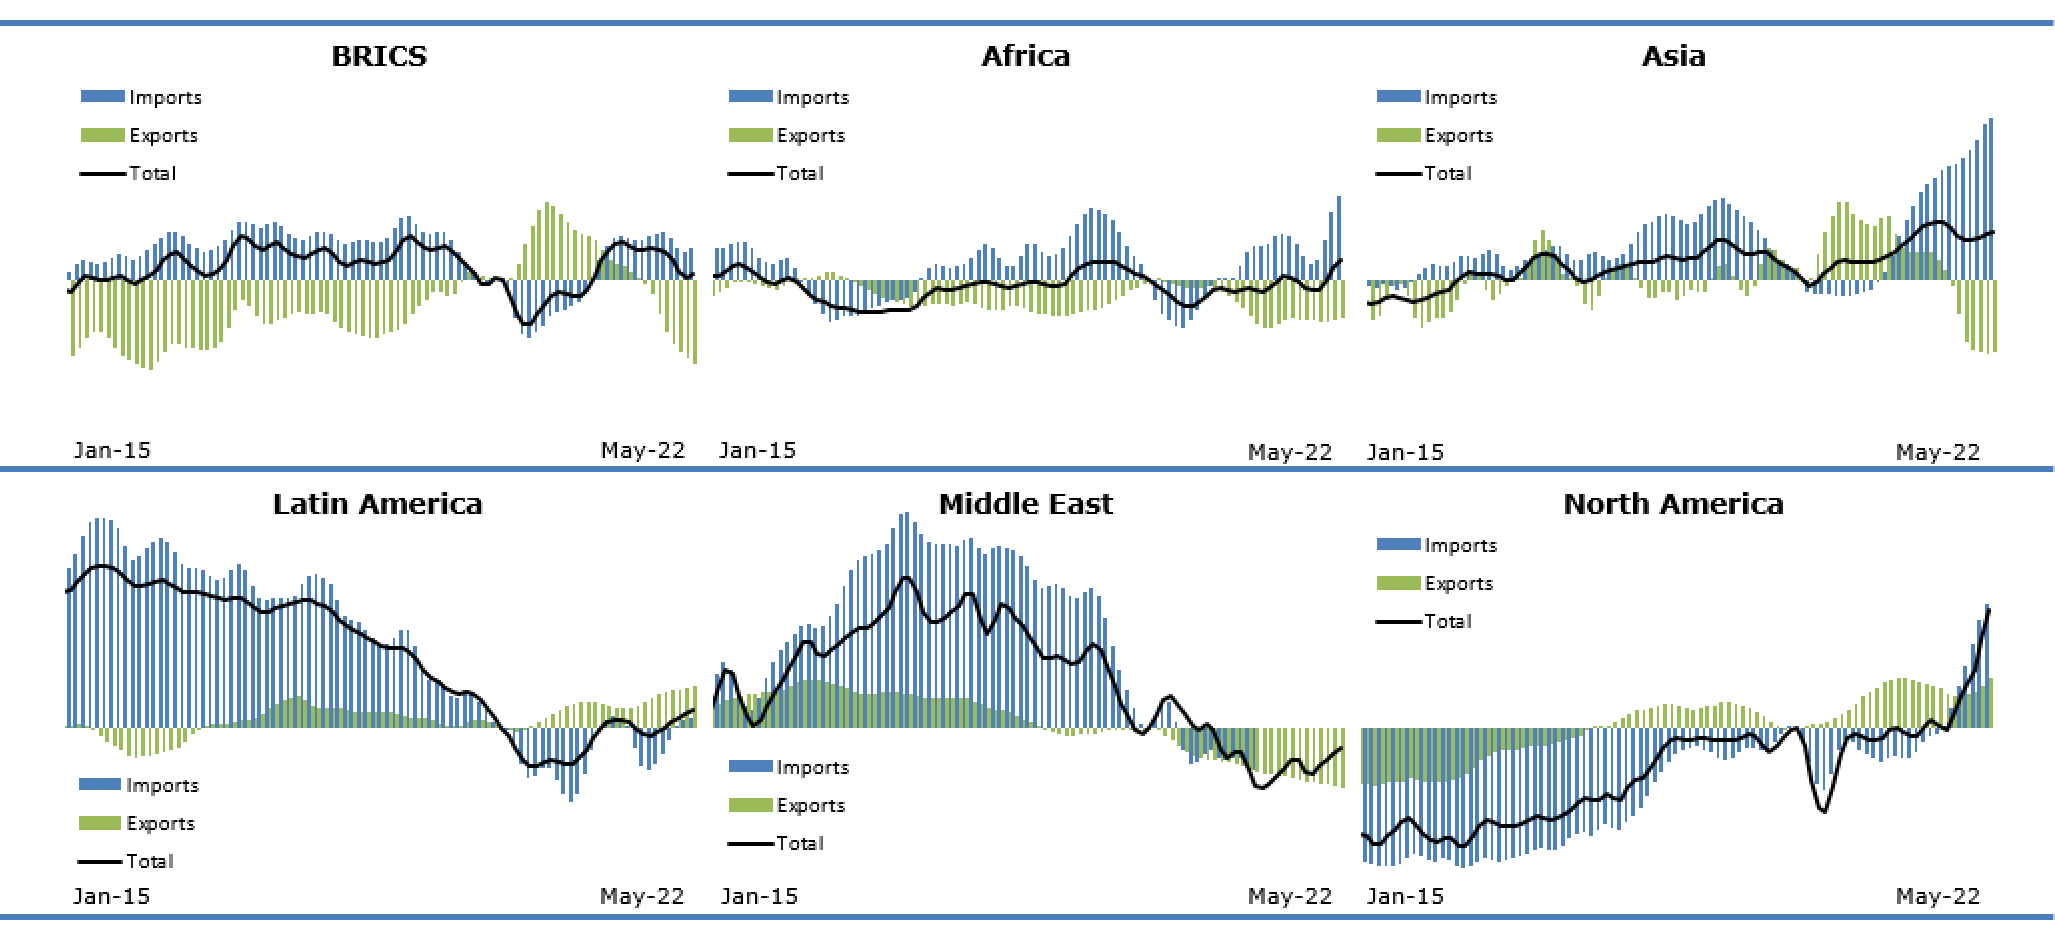
Figure 4.EU27 external trade by air, percentage change from February 2020
(Tonnes, monthly trend, seasonally adjusted)

Figure 5.US external trade by sea, percentage change from February 2020
(Tonnes, monthly trend, seasonally adjusted)
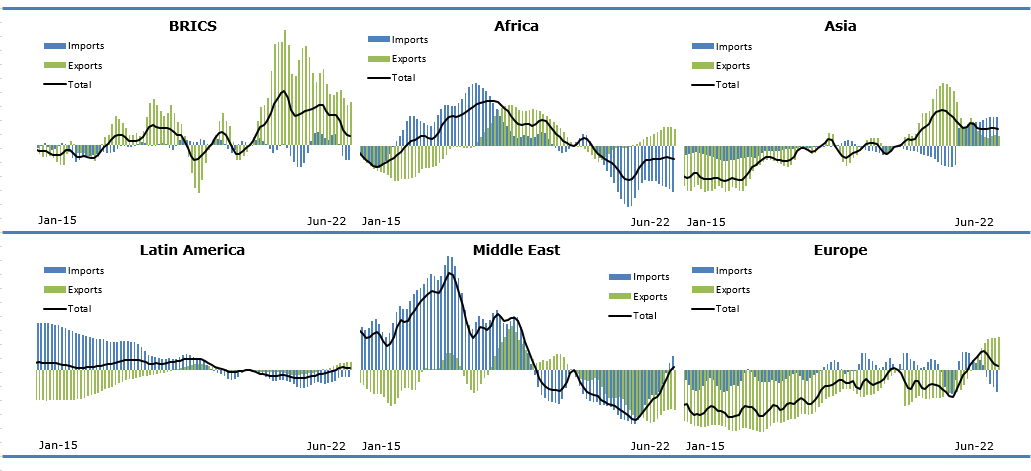
Figure 6.US external trade by air, percentage change from February 2020
(Tonnes, monthly trend, seasonally adjusted)
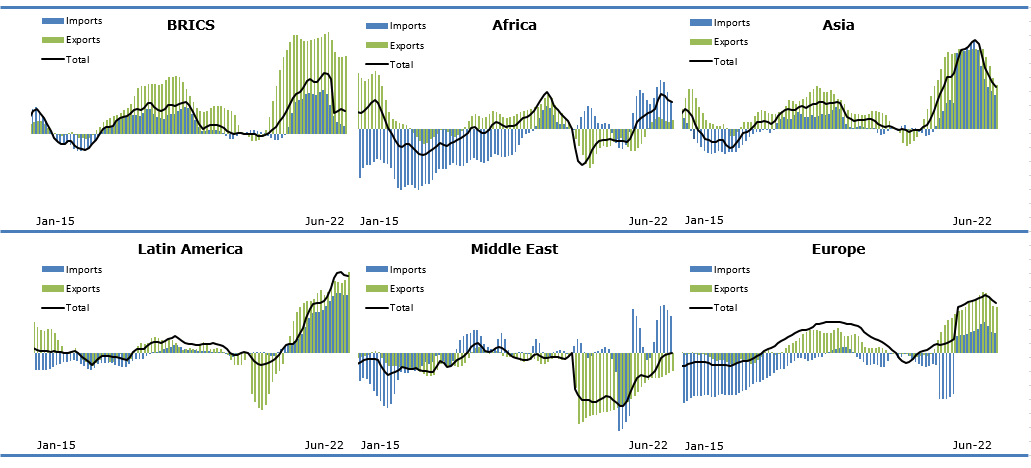
Figure 7. US and EU27 external trade by rail and road, percentage change from February 2020
(Current values in USD/EUR, monthly trend, seasonally adjusted)
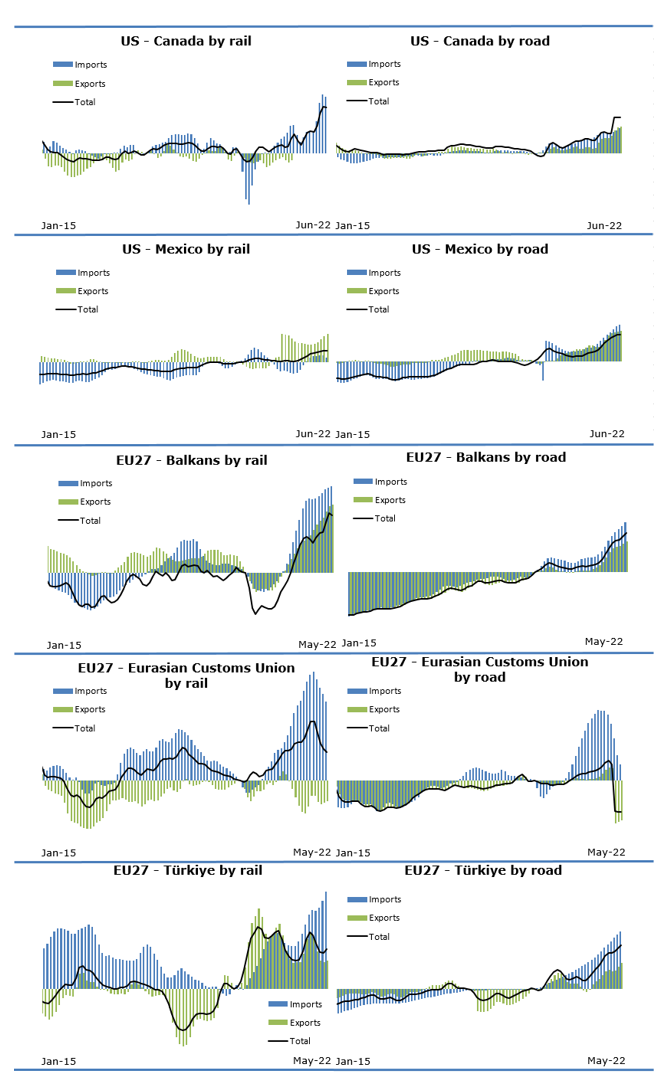
Note: Data for Balkans includes Albania, Bosnia-Herzegovina, FYROM, Kosovo, Moldova, Montenegro and Serbia.
Methodological note
The International Transport Forum Statistics Brief on Global Trade and Transport presents the latest global freight transport trends based on the Global Trade and Transport Database and the ITF Quarterly Transport Statistics. These data are collected by the Secretariat through a questionnaire and from external sources, including Eurostat, US Census and Japan Customs. National data are seasonally adjusted by the International Transport Forum Secretariat for analytical purposes.
Short-term data is normally compiled to allow timely identification of changes in any indicator and especially to identify possible turning points. However, monthly or quarterly transport statistics are often characterised by seasonal patterns. Seasonal adjustment filters out usual seasonal fluctuations that recur with similar intensity in the same season every year. Trend, in turn, excludes also other irregular factors (such as strikes and impact of weather) from a time series. A time series from which the seasonal variations have been eliminated basically allows for the comparison of data between two quarters for which seasonal patterns are different, also helping to identify turning points and the underlying direction of the change.
Seasonal adjustment is carried out with the Demetra program using the TRAMO/SEATS adjustment method. Seasonally adjusted estimates may differ from those produced by national authorities due to differences in the adjustment methodology. A detailed description of the methodology is available here. If you would like to receive further issues of the Statistics Brief or more information, please contact Rachele Poggi (rachele.poggi@itf-oecd.org) or Diego Botero (diego.botero@itf-oecd.org). More information on ITF transport statistics is available here.